Crypto Technical Analysis for Beginners in Romania 2026
Crypto Technical Analysis for Beginners in Romania 2026
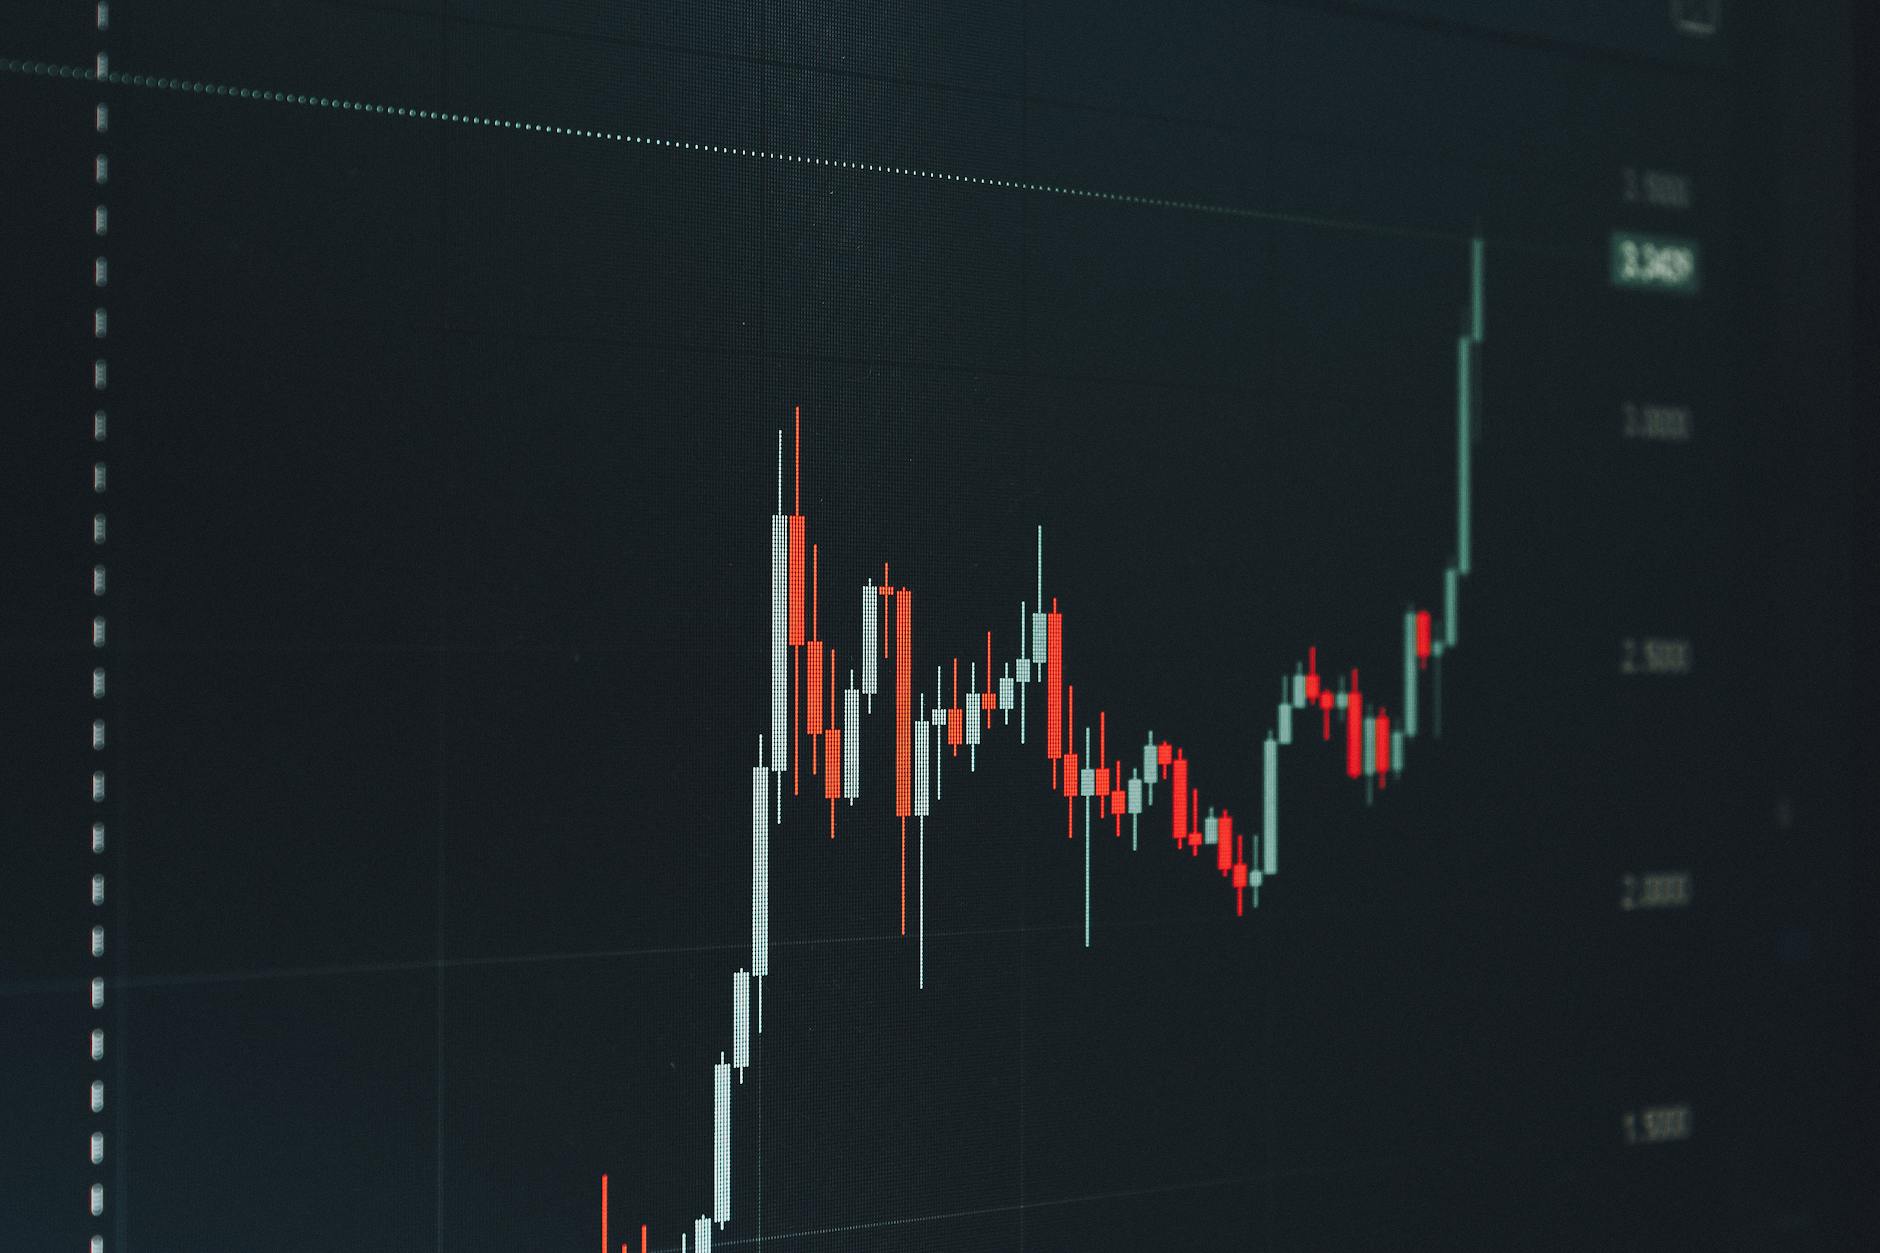
A young professional in Bucharest opened a crypto exchange app for the first time in early 2026. She stared at a red-and-green candlestick chart of Bitcoin and felt completely lost. Within 10 minutes of using Chartscope — an AI-powered educational app — she understood what RSI divergence meant and why the chart had formed a Doji pattern. That’s the gap this guide closes: turning confusing crypto charts Romania beginners face into clear, learnable concepts.
Why Crypto Technical Analysis Matters for Beginners in Romania

The Problem with Jumping In Blind
Romania has one of the fastest-growing cryptocurrency adoption rates in Eastern Europe. Yet most beginners start trading without understanding basic chart patterns. Technical analysis — the study of price movements using historical data — helps you answer two critical questions: What is the market doing right now? and What patterns have formed before similar price moves?
Without this foundation, beginners rely on social media tips or gut feelings. ChartScope processes all analysis locally on your iPhone using Apple’s Core ML framework — no cloud servers involved. This means your learning happens in real time, on your device, with zero data leaving your phone.
What Beginners in Romania Actually Need
The Romanian crypto community is active, but educational resources in Romanian are scarce. Most technical analysis guides are written in English with heavy jargon. ChartScope addresses this gap by supporting 9 languages including Romanian (RO). You can learn in your native language while exploring real market data.
Three Numbers Every Beginner Should Know
| Metric | What It Means | Why It Matters for Beginners |
|---|---|---|
| €4.99/month | Subscription price with 3-day free trial | Low barrier to entry for testing the app |
| ~1ms inference | CoreML trend classification speed on iPhone Neural Engine | Instant feedback without waiting |
| 9 languages | Including Romanian (RO) | Learn in your native language |
Chartscope: Your AI Guide to Crypto Charts in Romania

How AI Chat Makes Learning Conversational
Traditional crypto education forces you to read static articles or watch hour-long videos. ChartScope’s AI Chat feature changes this entirely. You can ask questions like “Why did Bitcoin drop 3% in the last hour?” and get a plain-language explanation that references the specific coin and timeframe you’re viewing.
The AI is context-aware — it knows which cryptocurrency and time period you’re analyzing. Follow-up questions build on previous answers. If you ask “What does the MACD show?” after discussing RSI, the AI connects both indicators for you.
Try it now: Open ChartScope, select any coin on the 1-hour chart, and ask “What’s happening with this chart right now?” The AI will walk you through price action, volume, and key indicators in plain Romanian.
AI Vision: Your Second Pair of Eyes
Candlestick patterns are the building blocks of technical analysis. A Doji indicates indecision. An Engulfing pattern suggests a potential reversal. A Shooting Star warns of a possible top. But spotting these patterns manually takes practice.
ChartScope’s AI Vision feature reads your chart screenshot and identifies candlestick formations automatically. It can detect Doji, Engulfing, Shooting Star, and other patterns — then explain what they mean in context. You control this feature separately through consent settings, so you decide when to use visual AI.
Structured Insights: Beyond Just Numbers
The app’s Insights v6 system delivers 9 structured cards covering: - Market Mood — a thermometer from 0 to 100 showing sentiment - Volatility — how much the price is moving - Momentum — the speed and direction of price changes - Risk/Reward — quantified ratio for potential moves - Indicator Conflicts — when RSI says one thing and MACD says another
Each card is designed to teach. When the app detects a conflict between two indicators, it explains why they disagree and what that means for your understanding of the market.
Key Technical Indicators Explained for Romanian Beginners
RSI (Relative Strength Index) — The Momentum Meter
The RSI measures how fast prices are changing on a scale from 0 to 100. When RSI goes above 70, the asset might be “overbought.” Below 30, it might be “oversold.” But here’s the nuance beginners miss: RSI can stay overbought during strong uptrends.
ChartScope explains RSI in context. If you’re looking at a coin that’s been rising for days, the app will tell you whether the RSI confirms the trend or warns of exhaustion. For a deeper dive, read our dedicated guide on RSI & MACD Indicators Explained for Crypto Charts 2026.
MACD (Moving Average Convergence Divergence) — Trend Strength
MACD shows the relationship between two moving averages of price. When the MACD line crosses above the signal line, it suggests upward momentum. A cross below signals downward momentum.
The trick is combining MACD with other indicators. ChartScope’s AI Chat can explain why MACD might show bullish signals while volume tells a different story. This multi-indicator approach separates educated analysis from guesswork.
Moving Averages — The Trend Line
Simple Moving Averages (SMA) and Exponential Moving Averages (EMA) smooth out price data to show the overall direction. The 50-day and 200-day moving averages are particularly watched by traders worldwide.
When price crosses above the 200-day moving average, it’s often called a “golden cross” — a long-term bullish signal. When it crosses below, it’s a “death cross.” ChartScope explains these events in plain language, referencing your specific chart.
Mastering Candlestick Patterns with AI Vision in Romania

Step-by-Step: How to Analyze a Candlestick Pattern
Here’s a practical workflow you can follow with ChartScope:
- Open ChartScope and select a coin — Choose any cryptocurrency available on your connected exchange
- Set your timeframe — Start with the 1-hour chart for short-term patterns or daily for longer-term trends
- Take a screenshot of an interesting formation — Look for a pattern you don’t recognize
- Open AI Vision — Grant consent for visual analysis (you control this separately)
- Upload the screenshot — The Vision LLM reads your chart and identifies patterns
- Review the explanation — The AI tells you what pattern it found and what it typically means
- Ask follow-up questions in AI Chat — “How reliable is this pattern?” or “What confirmation should I look for?”
Common Patterns AI Vision Can Identify
| Pattern | What It Looks Like | What It Typically Suggests |
|---|---|---|
| Doji | Open and close prices are nearly equal | Market indecision, possible reversal |
| Engulfing | One candle completely covers the previous one | Strong reversal signal |
| Shooting Star | Small body with long upper wick | Potential top after an uptrend |
| Hammer | Small body with long lower wick | Potential bottom after a downtrend |
| Morning Star | Three-candle pattern: bearish, indecision, bullish | Bullish reversal signal |
Why AI Vision Beats Manual Learning
A beginner might stare at a chart for 10 minutes and miss a clear Doji pattern. AI Vision identifies it in seconds and explains its significance. This accelerates the learning curve dramatically — you see patterns, understand them, and recognize them faster next time.
Chartscope’s Unique Approach to Privacy and Education
Zero Tracking, Zero Data Collection
Most crypto apps track your every move — which coins you view, how long you spend, what you search. ChartScope does the opposite. The app collects zero personal data: no email addresses, no location data, no usage analytics, no portfolio history.
Your API credentials are stored exclusively in the iOS Keychain with hardware-level encryption. They never leave your device. All AI analysis runs locally using Apple’s Core ML framework — no cloud processing, no third-party servers.
Educational Design, Not Trading Signals
ChartScope explicitly states it does not provide financial advice, investment recommendations, or trading signals. Every feature is designed to teach, not to tell you what to buy or sell. The AI explains why a pattern formed, not what you should do about it.
This distinction matters because it keeps the focus on learning. You build genuine understanding rather than developing dependency on signals.
9 Languages Including Romanian
The app supports English, Romanian, German, French, Spanish, Italian, Portuguese, Chinese, and Japanese. For Romanian beginners, this means you can learn technical analysis in your native language without translating concepts mentally.
Pricing That Makes Sense
At €4.99/month with a 3-day free trial, ChartScope costs less than a coffee per week. Compare that to crypto courses that charge €200+ for static video content. The app updates continuously with new features — version 1.0.3 introduced AI Chat, AI Vision, and Insights v6.
To see how ChartScope compares to other learning methods, read our Best Crypto Education App Romania 2026 guide.
Frequently Asked Questions
What is crypto technical analysis and why is it important for beginners in Romania?
Crypto technical analysis is the study of historical price and volume data to understand market behavior. For beginners in Romania, it provides a structured way to interpret charts without relying on rumors or social media tips. ChartScope teaches this through AI-powered explanations in Romanian, making complex concepts accessible to anyone with an iPhone.
How does Chartscope help Romanian beginners understand crypto charts?
ChartScope uses three core features: AI Chat for conversational Q&A about your specific coin and timeframe, AI Vision for visual pattern recognition of candlestick formations, and Insights v6 with 9 structured cards covering volatility, momentum, and indicator conflicts. All processing happens on-device using CoreML, and the app supports Romanian language.
Can Chartscope explain complex technical indicators in plain language?
Yes. The AI Chat feature breaks down RSI, MACD, moving averages, and other indicators into simple explanations. It avoids jargon and never gives trading signals — always explaining why something is happening rather than telling you what to do. The context-aware AI knows which coin and timeframe you’re viewing.
Is Chartscope suitable for learning about candlestick patterns?
Absolutely. The AI Vision feature reads your chart screenshots and identifies patterns like Doji, Engulfing, Shooting Star, and Hammer. It explains what each pattern typically means and how it fits into the broader market context. You control when to use visual AI through separate consent settings.
What makes Chartscope a privacy-focused app for crypto education in Romania?
ChartScope collects zero personal data — no email, no location, no usage analytics. API keys are stored in the iOS Keychain with hardware encryption. All AI processing happens on-device using Apple’s Core ML framework, meaning no data ever leaves your iPhone. The app uses no tracking scripts or third-party analytics.
Continue Learning
- Learn Crypto Chart Analysis for Beginners in Romania 2026
- Top Crypto Technical Indicators for Analysis in Romania 2026
- AI Crypto Education App Pricing Romania 2026
This is educational content, not financial advice. Always do your own research before investing.
Last updated: 2026-05-27