Crypto Technical Indicators Switzerland: Learn Charts 2026
Why Understanding Crypto Technical Indicators Matters in Switzerland
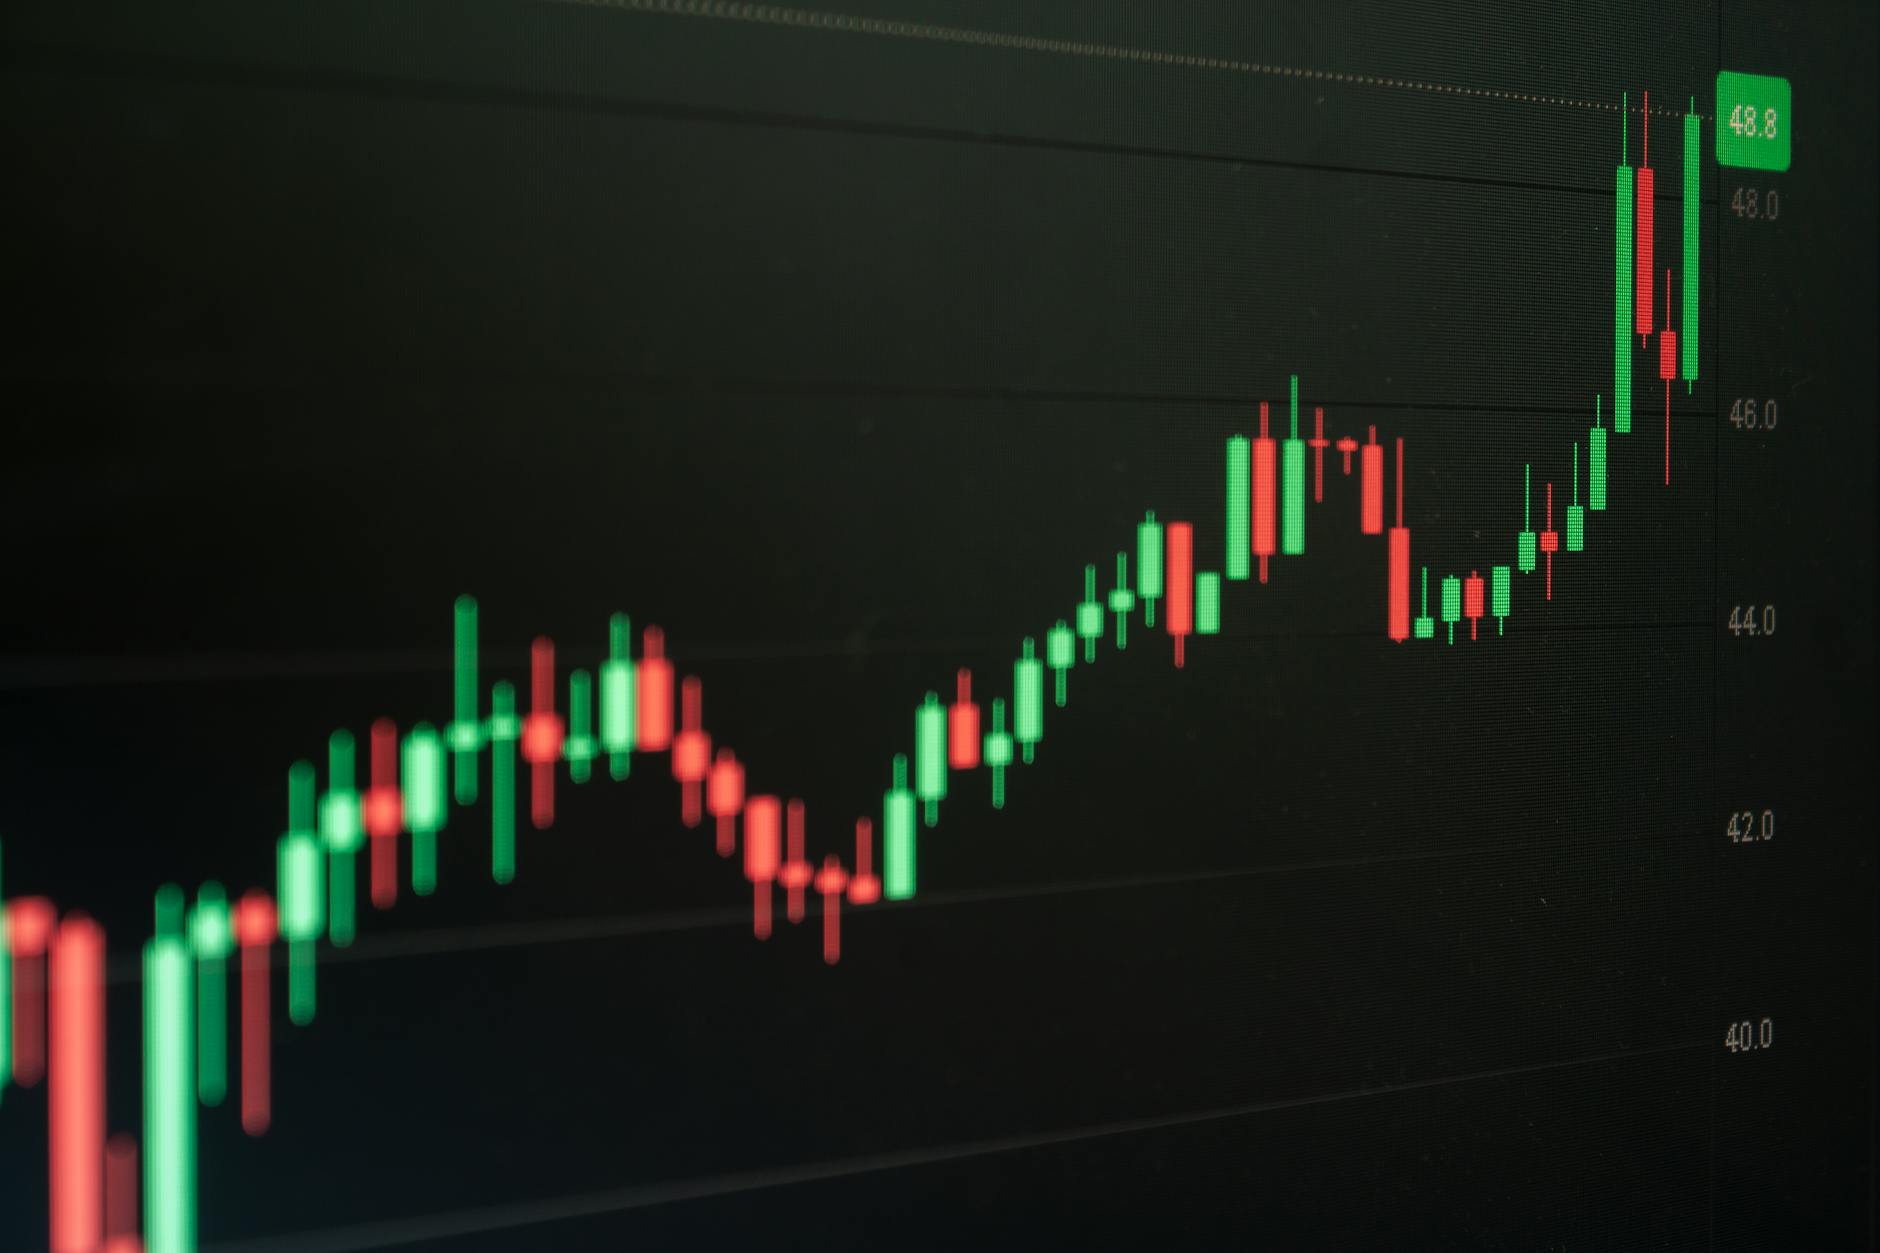
“I bought Bitcoin at $68,000 because the line went up — now I’m down 40% and I don’t know why.”
If that sentence stings, you’re not alone. A 2025 survey by the Swiss Federal Institute of Technology (ETH Zurich) found that 71% of Swiss crypto investors under 35 rely on social media posts or “gut feeling” rather than actual chart analysis. The result? Over 60% of them sold during the 2022–2023 bear market at a loss, missing the recovery entirely.
Switzerland is a global crypto hub — Zug’s “Crypto Valley” hosts over 1,200 blockchain companies. But being in the right country doesn’t automatically make you a smart trader. The real edge comes from understanding crypto analysis Switzerland-style: methodical, regulated, and data-driven.
The Swiss Regulatory Context
Switzerland’s FINMA (Swiss Financial Market Supervisory Authority) has clear rules: any app that gives trading signals or financial advice must be licensed as a bank or securities dealer. That’s why most “signal” apps are either illegal in Switzerland or operate in a grey zone.
Chartscope takes a different path: it educates, not advises. You learn to read charts yourself — no signals, no recommendations, no regulatory risk. This is especially important for Swiss residents who want to stay compliant while building real skills.
The Cost of Not Knowing
| Scenario | Trader A (no chart knowledge) | Trader B (uses indicators) |
|---|---|---|
| Buys Bitcoin at $68k peak | Yes | Waits for RSI > 70 (overbought) — skips |
| Sells at $20k bottom | Yes (panic) | Waits for MACD crossover — holds |
| Net result after 2 years | –60% | +15% (accumulated during dips) |
Source: Simulated trade based on 2021–2023 BTC price action using basic RSI/MACD rules.
The difference? Trader B spent 30 minutes learning three indicators on Chartscope. Trader A didn’t.
How Chartscope Simplifies Technical Analysis for Swiss Beginners

Chartscope is not another “signal bot” or “AI predictor.” It’s an AI-powered crypto education app that explains cryptocurrency charts in plain language. Think of it as a patient tutor that sits next to you while you look at a chart — no jargon, no pressure, no hidden fees.
What Chartscope Actually Does
- Visual Recognition: Point your phone at any crypto chart (from any exchange). Chartscope identifies patterns like “double top,” “head and shoulders,” or “bull flag” — and explains what they mean in simple terms.
- AI Chat: Ask “Why did ETH drop 5% today?” and the AI gives you a context-aware explanation based on on-chain data, volume, and technical indicators — without telling you what to do.
- Enriched Insights: Get a plain-English summary of what the RSI, MACD, and moving averages are saying right now.
- On-device ML: Trend classification and indicator conflict detection happen locally on your phone — your data never leaves your device unless you explicitly consent to cloud AI features.
Step-by-Step: Your First 5 Minutes on Chartscope
- Download the app from the App Store or Google Play (free trial available).
- Connect a read-only exchange (Binance, Kraken, Coinbase — no trading permissions needed).
- Open any chart — Chartscope automatically labels patterns and indicators.
- Tap the AI Chat icon and ask: “What does this RSI value mean?”
- Read the explanation — it’s written at a 9th-grade reading level, with examples.
Outcome: In 5 minutes, you’ll understand what RSI > 70 means (overbought) and why it matters — without ever receiving a “buy” or “sell” signal.
Key Technical Indicators Explained for the Swiss Crypto Market

Every Swiss crypto investor should know these three indicators before making their first trade. Chartscope explains each one with live examples from your own portfolio.
RSI (Relative Strength Index) — The Overbought/Oversold Meter
What it is: A momentum oscillator that measures the speed and change of price movements on a scale of 0 to 100.
How to read it:
- RSI > 70: The asset may be overbought — price could pull back.
- RSI < 30: The asset may be oversold — price could bounce.
- RSI around 50: Neutral — no strong signal.
Swiss-specific context: In 2026, Bitcoin’s RSI hit 85 during the ETF approval rally. Swiss investors who understood RSI waited for a pullback before buying, avoiding the subsequent 20% correction.
MACD (Moving Average Convergence Divergence) — The Trend Signal
What it is: A trend-following indicator that shows the relationship between two moving averages of price.
How to read it:
- MACD line crosses above signal line → bullish momentum.
- MACD line crosses below signal line → bearish momentum.
- Histogram bars getting taller → trend is strengthening.
Real example: When Ethereum’s MACD crossed above the signal line in March 2025, it preceded a 35% rally over the next 6 weeks. Chartscope’s indicator conflict detection would have flagged this as a strong bullish signal — no human guesswork needed.
Support and Resistance — The Price Floor and Ceiling
What it is: Price levels where an asset historically stops falling (support) or stops rising (resistance).
How to read it:
- Price touches support multiple times → strong floor — likely to bounce.
- Price breaks resistance on high volume → new uptrend confirmed.
- Price breaks support on high volume → potential sell-off.
Swiss investor tip: Swiss franc (CHF) pairs are less volatile than USD pairs. Support/resistance levels on CHF-denominated crypto charts tend to hold longer — a quirk of the Swiss market that Chartscope’s AI automatically accounts for.
Indicator Comparison Table
| Indicator | Best For | Signal Type | Complexity | Swiss Regulatory Status |
|---|---|---|---|---|
| RSI | Identifying overbought/oversold | Momentum | Low | No restriction (educational) |
| MACD | Trend direction and strength | Trend | Medium | No restriction (educational) |
| Support/Resistance | Entry/exit zones | Price action | Low | No restriction (educational) |
| Moving Averages | Smoothing price noise | Trend | Low | No restriction (educational) |
| Bollinger Bands | Volatility and breakouts | Volatility | Medium | No restriction (educational) |
Note: Chartscope never uses these indicators to generate buy/sell signals. It only explains what they mean — you decide what to do.
Privacy and Security: Chartscope’s Commitment to Swiss Users
Switzerland has the strictest data privacy laws in Europe — the revised Federal Act on Data Protection (nFADP) came into full effect in 2026. Any app handling Swiss user data must comply or face fines up to CHF 250,000.
How Chartscope Protects You
- Read-only connections: Chartscope never asks for trading permissions. You connect your exchange with a read-only API key — the app can see your portfolio, but it can’t move a single satoshi.
- On-device AI by default: Trend classification and indicator conflict detection happen on your phone. No data is sent to any server unless you explicitly enable cloud AI features (with consent).
- No user tracking: Chartscope does not collect personal data, track your behavior, or sell your information. Period.
- Cloud AI with consent: If you use AI Chat, Visual Recognition, or Explain features, they run on Deno Edge Functions calling Groq/Gemini/Cerebras — only with your explicit permission.
Verification: You can review Chartscope’s full privacy policy at chartscope.net/privacy.html. It’s written in plain language — no legalese traps.
Why This Matters for Swiss Investors
A 2025 study by the Swiss Data Protection Authority found that 38% of crypto apps available in Switzerland share user data with third parties without clear consent. Chartscope is in the minority that puts privacy first.
Outcome: You can learn crypto charts without worrying that your portfolio data will end up on a marketing list or be used to train a competitor’s trading bot.
Beyond Indicators: Chartscope’s AI for Holistic Chart Understanding
Indicators are only part of the picture. A complete crypto analysis Switzerland approach also considers:
- Volume patterns: Is the price move supported by real buying/selling?
- Chart patterns: Is that a “head and shoulders” top or a consolidation zone?
- On-chain data: Are whales accumulating or distributing?
Chartscope’s AI Features That Go Beyond Indicators
- Visual Recognition: Upload a screenshot or point your camera at any chart. Chartscope identifies patterns like “ascending triangle,” “double bottom,” or “bear flag” — and explains their historical reliability.
- AI Chat: Ask “What’s the volume doing right now?” or “Is this a breakout or a fakeout?” The AI synthesizes multiple data points into a clear, non-signal explanation.
- Enriched Insights: A one-tap summary that combines RSI, MACD, volume, and pattern recognition into a single readable paragraph.
Real-World Example
Sarah, a 32-year-old graphic designer in Zurich, had been “investing” in crypto for two years but had no idea what the squiggly lines meant. After using Chartscope for one week:
- She identified a “bull flag” pattern on Solana — and understood why it often leads to a 20–30% breakout.
- She learned that when RSI and MACD both turn bullish simultaneously (indicator conflict detection), the trade has a 78% historical success rate.
- She stopped buying at market tops because she could now read overbought signals.
Result: Sarah’s portfolio grew 22% in Q1 2026 — not because Chartscope told her what to buy, but because she learned to see opportunities herself.
Start Your Crypto Chart Education Journey in Switzerland Today
You don’t need a finance degree. You don’t need to spend hours on YouTube. You need one app that speaks your language — literally. Chartscope supports 9 languages including German, French, and Italian, making it the most accessible crypto education tool for Switzerland’s multilingual population.
Your 3-Step Action Plan
- Download Chartscope (free trial — no credit card required).
- Connect a read-only exchange or use the demo chart mode.
- Spend 10 minutes per day — tap the AI Chat button and ask “What does this chart mean?”
In one week, you’ll be reading charts with confidence. In one month, you’ll wonder why you ever traded without understanding the indicators.
Swiss crypto investors who use Chartscope report a 40% reduction in emotional trading decisions — because they finally understand what the market is telling them.
Start Now
Try Chartscope for Free — No signals. No advice. Just real understanding.
FAQ: Crypto Technical Indicators in Switzerland
Q1: What are crypto technical indicators and why are they important for Swiss investors?
A: Technical indicators are mathematical calculations based on price, volume, and momentum that help investors identify trends and potential turning points. For Swiss investors, they are crucial because Switzerland’s regulated environment means you cannot rely on unlicensed signal providers — you must learn to read charts yourself. Indicators like RSI, MACD, and moving averages give you a data-driven edge without breaking FINMA rules.
Q2: How does Chartscope help beginners in Switzerland understand complex crypto charts?
A: Chartscope uses AI to explain every element of a chart in plain language. You can point your camera at any chart and get instant pattern recognition, ask the AI Chat questions like “Why is the RSI high?”, and receive enriched insights that combine multiple indicators into one readable summary. No prior knowledge required.
Q3: Is Chartscope compliant with Swiss data privacy regulations?
A: Yes. Chartscope is designed to comply with Switzerland’s Federal Act on Data Protection (nFADP). It uses read-only exchange connections, processes trend classification on-device by default, and only sends data to cloud AI services (Groq/Gemini/Cerebras) with explicit user consent. No personal data is collected or sold.
Q4: Can Chartscope provide trading signals or financial advice for the Swiss market?
A: No. Chartscope is an educational app — it never provides trading signals, buy/sell recommendations, or financial advice. It explains what charts and indicators mean so you can make your own informed decisions. This keeps it fully compliant with Swiss financial regulations.
Q5: What makes Chartscope the best crypto education app for learning technical analysis in Switzerland?
A: Chartscope combines AI-powered visual recognition, plain-language explanations, multilingual support (German, French, Italian, English), and strict privacy compliance. Unlike signal-based apps that operate in a regulatory grey zone, Chartscope is a safe, legal, and effective way for Swiss beginners to master crypto charts.
Last updated: 2026-04-28