How to Use RSI in Crypto Trading
The Relative Strength Index is one of the most popular technical indicators in cryptocurrency trading—and for good reason. This step-by-step guide teaches you exactly how to read RSI signals, spot divergences, avoid common mistakes, and apply the indicator to volatile crypto markets with confidence.
1 Understand What RSI Measures
The Relative Strength Index (RSI) is a momentum oscillator that measures the speed and magnitude of recent price changes. Developed by J. Welles Wilder Jr. in 1978 and introduced in his book New Concepts in Technical Trading Systems, the RSI has become one of the most widely used technical indicators across all financial markets, including cryptocurrency.
The RSI produces a single value that oscillates between 0 and 100. This bounded range makes it easy to interpret at a glance: values near the top of the range suggest strong recent buying pressure, while values near the bottom indicate strong recent selling pressure. The midpoint at 50 serves as a neutral zone—readings above 50 generally indicate bullish momentum, and readings below 50 suggest bearish momentum.
What makes RSI particularly valuable for crypto traders is its ability to quantify momentum in markets that are notoriously volatile and emotional. Rather than trying to judge whether a 15% daily price swing is "too much" or "just getting started," the RSI gives you a mathematical framework to assess whether momentum is building, sustaining, or fading.
RSI at a Glance
Type: Momentum oscillator
Range: 0 to 100
Default period: 14 (candles/bars)
Key levels: 30 (oversold), 50 (neutral), 70 (overbought)
Best for: Identifying overbought/oversold conditions, spotting divergences, and confirming trend strength
2 Learn the RSI Formula Basics
You do not need to calculate RSI by hand—every charting platform does it automatically. But understanding the formula helps you interpret RSI readings more accurately and avoid treating the indicator as a black box.
The RSI calculation has two components. First, you compute the Relative Strength (RS), which is simply the ratio of average gains to average losses over a specified number of periods (typically 14):
Then, the RSI itself is derived from the RS value using a normalization formula that constrains the result to the 0–100 range:
Here is what this means in practical terms. The RSI looks at the last 14 candles (or whatever period you choose) and compares the average size of up-moves to the average size of down-moves. If the asset has been going up consistently with large green candles, the average gain will dwarf the average loss, the RS will be high, and the RSI will approach 100. Conversely, if the asset has been dropping steadily, the RS will be small and the RSI will approach 0.
Why 14 Periods?
Wilder originally designed the RSI for daily charts, and 14 days represented roughly half a trading month. While 14 remains the standard default, many crypto traders adjust this setting. A shorter period (like 7 or 9) makes the RSI more sensitive and reactive, generating more signals but also more false positives. A longer period (like 21 or 25) smooths out the RSI and reduces noise, but signals come later. Beginners should start with the default 14-period setting and only adjust after gaining experience.
3 Identify Overbought Conditions (RSI Above 70)
The most common use of RSI is identifying overbought conditions. When the RSI climbs above 70, it signals that the asset has experienced sustained buying pressure and the price may have risen too quickly relative to its recent history.
An overbought RSI reading does not automatically mean the price is about to drop. This is a critical misunderstanding that trips up many beginners. What it means is that momentum has been strongly bullish, and the probability of a pullback or consolidation is increasing. Think of it as a warning light, not a stop sign.
How to Read Overbought RSI in Practice
Consider Bitcoin rallying from $60,000 to $72,000 over two weeks. During this move, the daily RSI might climb from 55 to 78. The reading of 78 tells you that buying momentum has been dominant for the past 14 daily candles and the price has stretched upward. This does not mean you should immediately sell, but it does mean you should:
- Be cautious about opening new long positions at this level
- Watch for signs that the RSI is starting to turn downward from above 70
- Look at other indicators for confirmation before making any decisions
- Consider that in strong uptrends, the price can remain overbought for weeks
Common Overbought Trap
During major crypto bull runs, the RSI on the daily chart can stay above 70 for weeks or even months. Bitcoin's 2020–2021 bull run saw the weekly RSI remain above 70 for extended stretches while the price continued climbing. Blindly selling every time RSI crosses 70 in a strong trend will cause you to exit positions far too early. Always consider the broader trend context before acting on overbought readings.
4 Identify Oversold Conditions (RSI Below 30)
The mirror image of overbought conditions, an RSI reading below 30 indicates that selling pressure has been dominant and the asset may have declined too rapidly. This suggests the price could be due for a bounce or at least a pause in the selling.
Oversold readings in crypto can be particularly powerful signals because cryptocurrency markets are prone to panic selling and capitulation events. When fear takes over, prices can drop sharply in a short period, driving the RSI deep into oversold territory. These moments of extreme pessimism have historically been some of the best educational case studies for understanding market psychology.
Interpreting Oversold RSI on Crypto Charts
Imagine Ethereum dropping from $3,500 to $2,800 over the course of a week. The daily RSI might plunge from 48 to 22. A reading of 22 tells you that selling has been aggressive and relentless over the past 14 candles. At this point, you might observe:
- The selling pressure has pushed the price well below recent norms
- A technical bounce becomes increasingly likely, though the exact timing is uncertain
- The RSI turning upward from below 30 often marks the beginning of at least a short-term recovery
- The deepest oversold readings (below 20) tend to occur during significant market events
The Oversold Bounce Pattern
One of the most studied RSI patterns is the oversold bounce. It works like this: the RSI drops below 30, then crosses back above 30, and this crossback often coincides with a short-term price recovery. While not a guaranteed outcome, the pattern appears frequently enough on crypto charts to be worth monitoring. The strongest bounces tend to occur when the RSI drops below 20 and then recrosses 30, as this indicates a more extreme sell-off followed by a meaningful shift in momentum.
5 Spot RSI Divergence
RSI divergence is one of the most powerful and reliable signals the indicator can generate. It occurs when the price and the RSI move in opposite directions, suggesting that the underlying momentum is not supporting the current price trend. Divergences often precede significant reversals.
Bearish Divergence
Bearish divergence happens when the price makes a higher high but the RSI makes a lower high. This tells you that even though the price reached a new peak, the momentum behind the move was weaker than the previous rally. It is like a runner crossing the finish line at a slower pace each lap—the effort is fading even though they are still moving forward.
For example, if Bitcoin reaches $70,000 with an RSI of 75 and then rallies to $73,000 but the RSI only reaches 68, that is bearish divergence. The price went higher, but the momentum indicator went lower. This does not mean the price will immediately crash, but it is a warning that the uptrend may be losing steam.
Bullish Divergence
Bullish divergence is the opposite: the price makes a lower low but the RSI makes a higher low. This suggests that although the price dropped to a new trough, the selling pressure was actually weaker than during the previous decline. Momentum is improving even as the price falls, often indicating that a bottom is forming.
For instance, if Ethereum drops to $2,800 with an RSI of 25 and later falls to $2,600 but the RSI only drops to 32, that is bullish divergence. Despite the lower price, selling momentum is actually decreasing.
RSI Divergence Checklist
- Identify two or more comparable peaks (for bearish) or troughs (for bullish) on the price chart
- Compare the corresponding RSI readings at those same points
- Confirm the divergence: price and RSI should be moving in opposite directions
- Wait for price confirmation before acting—divergence alone is a warning, not a signal
- Check the timeframe: divergences on higher timeframes (daily, weekly) are more significant
- Look for volume confirmation—declining volume alongside bearish divergence strengthens the signal
6 Use RSI with Different Timeframes
The RSI works on any timeframe, but the signals it generates and their reliability vary significantly depending on which chart you are studying. Understanding how to match RSI timeframes to your analysis approach is essential for getting useful information from the indicator.
5-Minute and 15-Minute Charts (Scalping)
On very short timeframes, the RSI moves rapidly and produces frequent overbought and oversold readings. These signals are useful for identifying short-term momentum shifts within a larger trend. However, they generate many false signals and are heavily influenced by market noise. If you are studying short-term price behavior, pair RSI with tight support and resistance levels for better context.
1-Hour and 4-Hour Charts (Swing Analysis)
These mid-range timeframes offer a good balance between signal frequency and reliability. RSI readings on the 4-hour chart tend to capture meaningful momentum shifts that play out over days to weeks. Many crypto analysts consider the 4-hour RSI their primary tool because it filters out short-term noise while remaining responsive to developing trends. Divergences spotted on 4-hour charts are particularly worth paying attention to.
Daily and Weekly Charts (Position Analysis)
On daily and weekly charts, RSI signals are infrequent but carry the most weight. A weekly RSI reading below 30 for Bitcoin, for example, has historically occurred only during major market downturns and has preceded significant recoveries. These higher-timeframe signals are most useful for understanding the broader market cycle and long-term trend direction. When the daily and weekly RSI agree (both oversold or both overbought), the signal is considerably stronger.
Multi-Timeframe Analysis Tip
The most effective way to use RSI is to check it across multiple timeframes simultaneously. Start with the higher timeframe (daily or weekly) to determine the overall trend direction, then move to a lower timeframe (4-hour or 1-hour) for entry timing. If the daily RSI is above 50 (bullish trend) and the 4-hour RSI just bounced from oversold territory, the signals align and the reading is more meaningful than either one in isolation.
7 Combine RSI with Moving Averages
RSI becomes significantly more useful when you combine it with other technical indicators, and one of the most effective combinations is pairing RSI with Exponential Moving Averages (EMAs). Moving averages define the trend, and RSI measures the momentum within that trend—together they give you a more complete picture.
The RSI + EMA Strategy Framework
The concept is straightforward: use moving averages to determine the overall trend direction, and then use RSI to identify high-probability entry points within that trend. Here is how it works in practice:
- Define the trend: Plot the 50-period and 200-period EMAs on your chart. When the 50 EMA is above the 200 EMA, the trend is generally bullish. When it is below, the trend is bearish.
- Wait for RSI confirmation: In a bullish trend (50 EMA above 200 EMA), look for RSI dips below 40 or 30 as potential areas of interest. These pullbacks within an uptrend often represent temporary weakness rather than trend reversals.
- Watch the crossover: When the RSI starts recovering from oversold territory and the price is bouncing off a key EMA (such as the 50 EMA acting as dynamic support), both indicators are confirming the same narrative.
EMA Crossover + RSI Confirmation Example
Suppose the 50-day EMA crosses above the 200-day EMA for Solana (a "golden cross"). This signals a potential shift to a bullish trend. Instead of immediately acting on this signal, you wait for the RSI to pull back to around 40–45 during a minor price dip. When the RSI then turns back upward and the price bounces off the 50 EMA, you have three confirming signals: the EMA crossover (trend is bullish), the EMA acting as support (trend is holding), and the RSI recovery (momentum is returning).
When Signals Conflict
Sometimes the RSI and moving averages will give you contradictory signals. For example, the EMAs might suggest a bullish trend, but the RSI shows bearish divergence. When signals conflict, caution is the safest approach. Conflicting signals often precede sideways price action or minor corrections. Waiting for alignment between your indicators helps filter out low-quality signals and keeps you focused on higher-conviction scenarios.
8 Apply RSI to Crypto-Specific Patterns
Cryptocurrency markets behave differently from traditional stock or forex markets, and this has important implications for how you interpret RSI. The extreme volatility, 24/7 trading hours, and sentiment-driven price swings of crypto mean you may need to adjust your RSI approach.
Adjusting RSI Levels for Crypto Volatility
The standard 70/30 overbought/oversold levels were designed for less volatile traditional markets. In crypto, particularly during strong trending phases, many experienced analysts use 80/20 levels instead. Here is why:
- During crypto bull runs, the RSI regularly exceeds 70 and can sustain readings of 75–85 for weeks. Using 70 as your overbought threshold in this environment would have you constantly expecting a reversal that never comes.
- During crypto bear markets, the RSI can drop below 30 and stay there as selling accelerates. An 80/20 threshold better captures the truly extreme conditions that are more likely to precede a meaningful reversal.
- Mid-cap and small-cap altcoins tend to be even more volatile than Bitcoin or Ethereum, so 80/20 levels can be even more appropriate for these assets.
Crypto Market Cycles and RSI
Crypto markets tend to move in pronounced cycles of accumulation, markup, distribution, and markdown. The RSI behaves differently in each phase:
- Accumulation phase: RSI oscillates between 30 and 60, with occasional dips below 30 that quickly recover. This sideways RSI behavior reflects the lack of a strong trend.
- Markup (bull) phase: RSI consistently stays above 40 and frequently pushes above 70. Pullbacks to the 40–50 RSI range tend to be short-lived. The RSI "floor" rising is itself a bullish signal.
- Distribution phase: RSI starts showing bearish divergence—the price makes new highs but RSI peaks are lower. This is often the earliest warning that the trend is maturing.
- Markdown (bear) phase: RSI consistently stays below 60 and frequently drops below 30. Rallies to the 50–60 RSI range tend to fade. The RSI "ceiling" falling is a bearish signal.
Bitcoin Halving Cycles and RSI
Historically, Bitcoin has followed a roughly four-year cycle linked to its halving events. Studying how the weekly RSI behaved during previous cycles (2016–2017, 2020–2021) reveals repeating patterns: the weekly RSI tends to bottom around 30 near the cycle low, gradually climb during the accumulation phase, and reach sustained readings above 70 during the parabolic phase of the bull run. While past cycles do not guarantee future performance, this historical context adds depth to your RSI analysis.
9 Avoid Common RSI Mistakes
The RSI is a powerful tool, but it is also one of the most commonly misused indicators. Understanding the typical mistakes will save you from drawing incorrect conclusions and help you build a more robust analysis framework.
Mistake 1: Using RSI in Isolation
This is the most common error. The RSI is designed to be one part of a broader analysis toolkit, not a standalone signal generator. An RSI reading of 72 tells you that momentum has been bullish, but it tells you nothing about the broader trend, support and resistance levels, volume, or market sentiment. Always cross-reference RSI signals with at least one or two other indicators or analysis methods.
Mistake 2: Treating Overbought/Oversold as Automatic Reversal Signals
As discussed earlier, overbought does not mean "sell immediately" and oversold does not mean "buy immediately." In strong trends, the RSI can remain in extreme territory for extended periods. The most damaging version of this mistake is fading a strong trend—selling into a powerful rally or buying during a relentless sell-off just because the RSI reached a certain number.
Mistake 3: Ignoring Trend Context
The RSI behaves differently in uptrends and downtrends. In a bull market, RSI pullbacks to 40–50 often represent buying opportunities, and readings of 70+ can persist. In a bear market, RSI rallies to 50–60 often represent selling pressure resuming, and readings of 30 can persist. Applying the same rules regardless of the prevailing trend leads to consistently poor analysis.
Mistake 4: Using the Wrong Timeframe
A 5-minute RSI reading of 75 has a completely different significance than a daily RSI reading of 75. Short timeframe RSI signals are noisy and unreliable on their own. Beginners often make the mistake of obsessing over minute-by-minute RSI fluctuations when they should be focusing on higher timeframes that provide more reliable context.
RSI Best Practices
- Always check the RSI on multiple timeframes before drawing conclusions
- Combine RSI with at least one trend indicator (like moving averages) and one volume indicator
- Consider the broader market trend before interpreting overbought or oversold readings
- Pay more attention to RSI divergences than to simple threshold crosses
- Use the standard 14-period setting until you have enough experience to justify changing it
- Keep a study journal noting which RSI signals were accurate and which were not
- Never base decisions solely on a single indicator reading
10 Practice with AI-Powered Analysis Tools
Reading about RSI concepts is an important first step, but genuine understanding comes from applying these concepts to real cryptocurrency charts. The gap between theory and practice is where most beginners struggle—you know what overbought means, but can you identify it quickly and interpret it correctly in the context of a live, moving chart?
This is where hands-on practice with educational tools becomes invaluable. Instead of studying static textbook examples, you need to interact with real market data, see how RSI behaves during actual price movements, and build the pattern recognition skills that come only from repeated exposure.
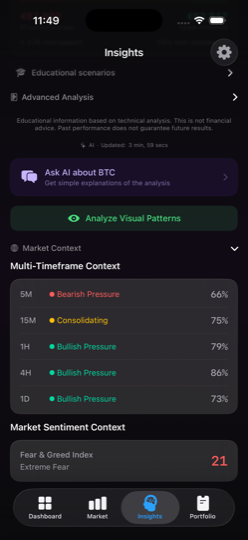
ChartScope is designed specifically for this kind of educational exploration. As an iOS app that uses on-device AI to analyze cryptocurrency charts, it lets you see RSI readings in context—alongside other indicators, on live market data, with plain-language AI explanations of what the indicators are showing.
How ChartScope Helps You Learn RSI
- Interactive indicators: See RSI plotted on real-time crypto charts from Binance, Coinbase, and Kraken
- AI explanations: Tap on any indicator reading to get a clear explanation of what it means in the current market context
- Multi-timeframe views: Switch between timeframes to practice the multi-timeframe analysis approach described in Step 6
- Privacy-first design: All analysis runs locally on your device using Apple Core ML—your data never leaves your iPhone
- No tracking: Learn without worrying about data collection, analytics, or advertising
The best way to internalize RSI concepts is to spend time each day reviewing charts: identify overbought and oversold conditions, look for divergences, and check your RSI readings across multiple timeframes. Over time, these patterns become second nature. The AI-powered explanations in ChartScope accelerate this learning process by providing immediate context for what you are seeing, so you do not have to wonder whether you are interpreting a signal correctly.
Start Practicing RSI Analysis Today
Download ChartScope and explore RSI on real cryptocurrency charts with AI-powered explanations. Learn by doing, not just reading. Free 3-day trial included.
Download on the App StoreSummary: Your RSI Learning Roadmap
The RSI is a deceptively simple indicator—easy to read at a glance, but rich with nuance once you understand the details. Here is a quick recap of the ten steps covered in this guide:
- Understand the basics: RSI is a momentum oscillator that measures price change velocity on a 0–100 scale.
- Know the formula: RSI compares average gains to average losses over 14 periods.
- Read overbought (above 70): Strong buying momentum, potential for pullback, but not an automatic sell signal.
- Read oversold (below 30): Strong selling momentum, potential for bounce, but not an automatic buy signal.
- Spot divergences: When price and RSI disagree, the momentum shift often precedes a price reversal.
- Use multiple timeframes: Higher timeframes for reliable context, lower timeframes for timing.
- Combine with moving averages: EMA crossovers plus RSI create stronger, more reliable signals.
- Adjust for crypto: Consider 80/20 levels for the extreme volatility of cryptocurrency markets.
- Avoid mistakes: Never use RSI alone, always consider trend context, and stay on appropriate timeframes.
- Practice on real charts: Hands-on experience with tools like ChartScope builds real skill far faster than theory alone.
Technical analysis is a skill that develops over time through study and practice. The RSI is an excellent indicator to master early in your learning journey because its concepts—momentum, overbought and oversold conditions, divergence—are foundational to understanding virtually every other technical indicator you will encounter.
Important Disclaimer
This article is for educational purposes only and does not constitute financial advice, investment recommendations, or trading signals. Cryptocurrency markets are highly volatile and carry significant risk. You could lose some or all of your invested capital.
The RSI and all other technical indicators are tools for studying historical price patterns. Past performance does not guarantee future results. No indicator, pattern, or analysis method can predict market movements with certainty.
ChartScope is an educational tool designed to help you learn about technical analysis concepts. It does not provide financial advice. Always conduct your own research and consult with a qualified financial advisor before making any investment decisions.