Free App to Learn RSI and MACD for Crypto Trading in 2026

Free App to Learn RSI and MACD for Crypto Trading in 2026
Yes — and the contrarian truth is this: you don’t need a paid course, a $200/month signal group, or a decade of experience to read RSI and MACD like a professional. The barrier to entry in technical analysis education has collapsed. In 2026, a free 3-day trial of an on-device AI tutor can teach you what most traders learn through years of expensive trial and error. The real question isn’t whether a free app exists to learn RSI and MACD indicators for crypto in 2026 — it’s which one actually teaches you instead of just showing you pretty charts.
Most crypto education platforms bury beginners in jargon. They throw 40 indicators on a screen and call it “analysis.” That’s not education — that’s noise. What you need is a tool that explains why the RSI is at 72 and what a MACD crossover actually implies, in plain language, on your own chart.
This guide breaks down exactly what to look for in a crypto learning platform, how to practice RSI and MACD using Chartscope tools, and how to build a consistent strategy in 2026 — without ever receiving a single trading signal.
Why RSI and MACD Are Essential for Modern Crypto Traders
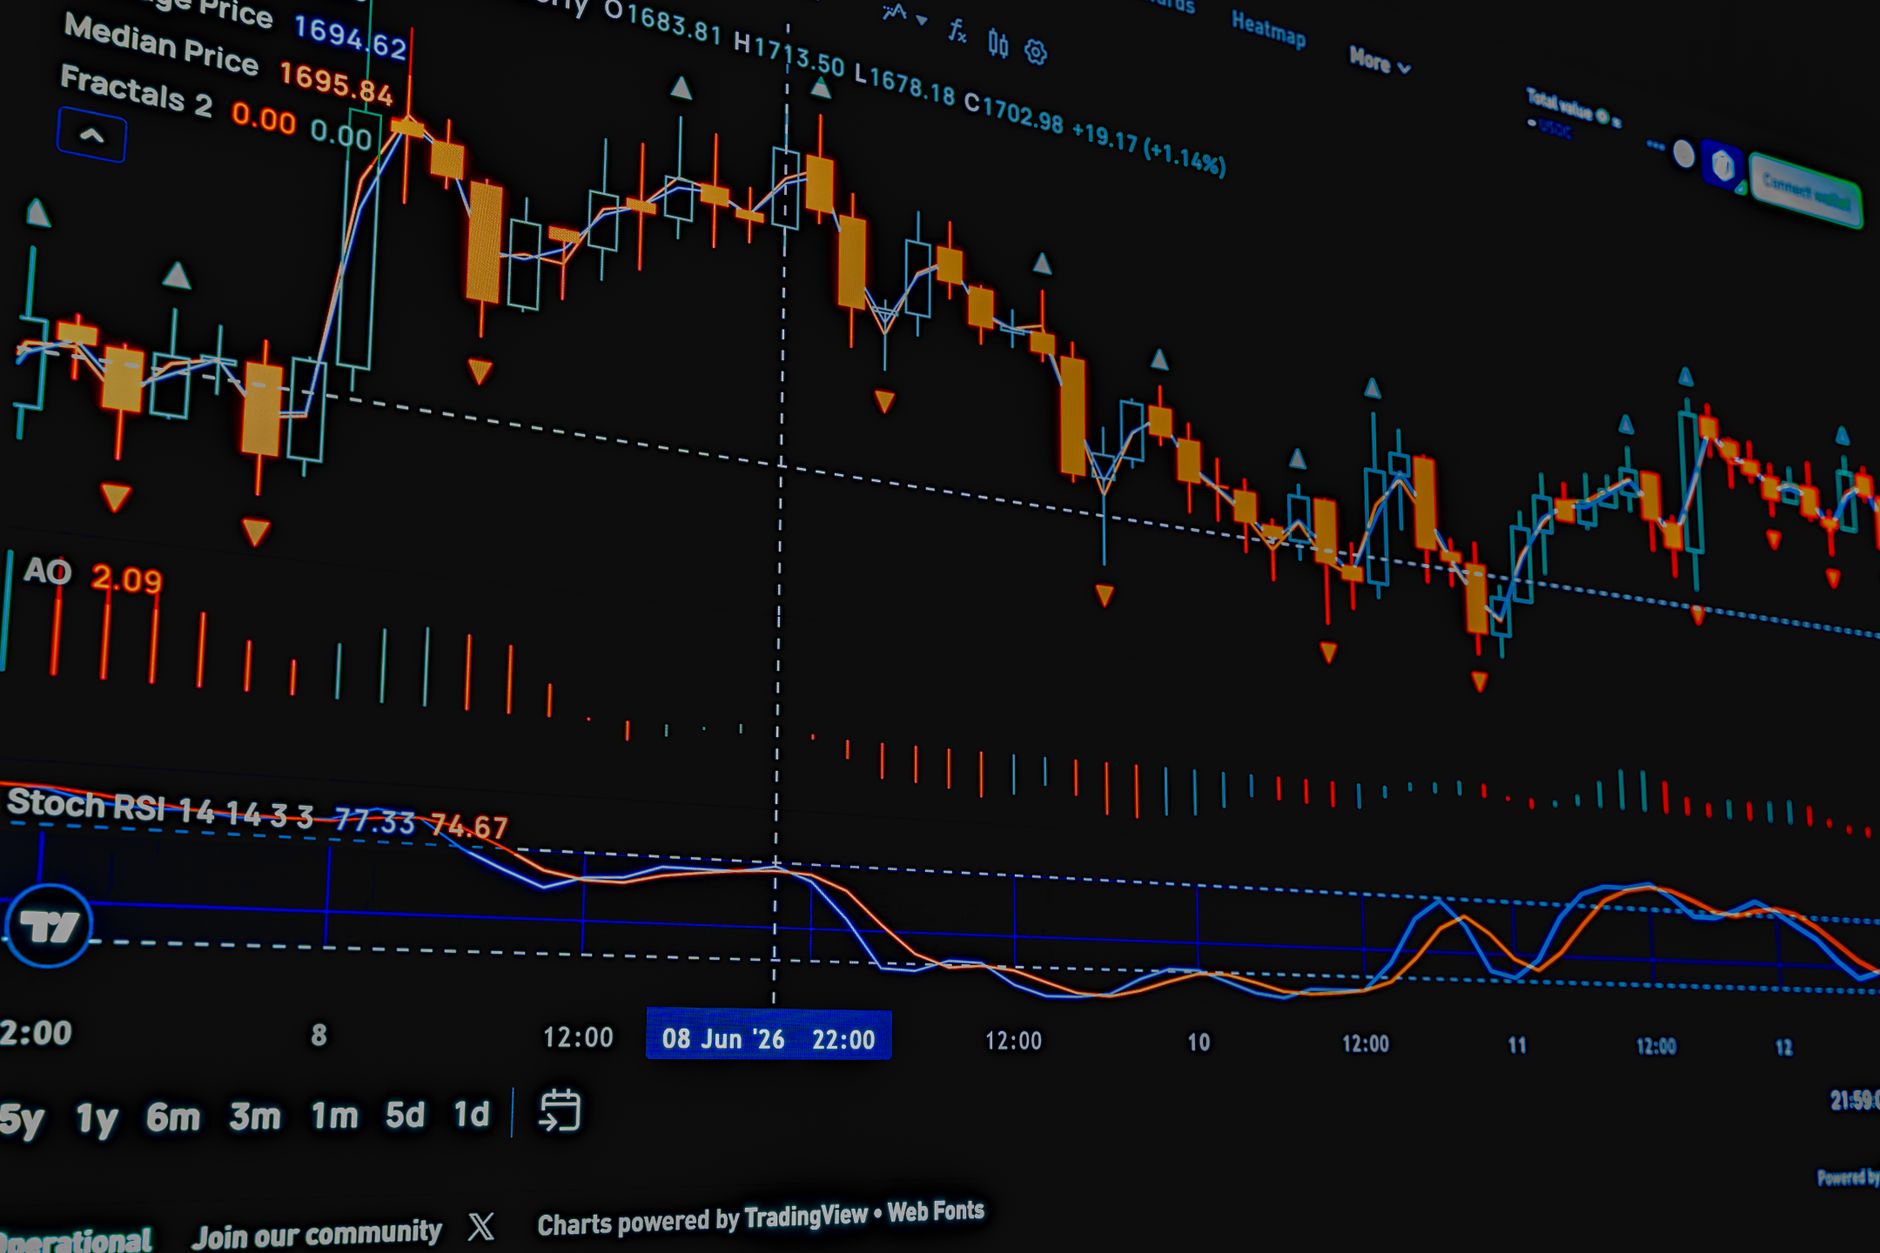
Crypto markets trade 24/7. Unlike traditional stock exchanges with opening bells and closing auctions, Bitcoin and Ethereum never sleep. This constant motion creates a unique challenge: you need indicators that measure momentum and trend direction across all timeframes.
RSI: The Overbought/Oversold Engine
The Relative Strength Index (RSI) is a momentum oscillator that measures the speed and change of price movements. It ranges from 0 to 100. Traditionally, readings above 70 signal overbought conditions, while readings below 30 signal oversold conditions.
But here’s what most tutorials skip: RSI in crypto behaves differently than in stocks. Because crypto is more volatile, many traders in 2026 use modified thresholds — 80/20 or even 90/10 — to filter out false signals. A trader who treats a 65 RSI reading on Bitcoin’s 4-hour chart as “overbought” will likely get stopped out repeatedly.
MACD: The Trend-Following Workhorse
The Moving Average Convergence Divergence (MACD) shows the relationship between two exponential moving averages (typically the 12-period and 26-period EMA). The MACD line crossing above the signal line is a bullish signal; crossing below is bearish.
In crypto’s whipsaw-prone markets, MACD crossovers on low timeframes produce many false signals. The key is context — and that’s exactly where most educational apps fail.
The 2026 Reality: Context Beats Memorization
Here’s the uncomfortable truth: knowing that “RSI above 70 = overbought” is not a strategy. It’s a fact. The strategy comes from understanding why RSI is diverging from price, how MACD confirms or contradicts the RSI reading, and when to ignore both.
A trader who understands that RSI divergence (price making higher highs while RSI makes lower highs) often precedes reversals has an edge. A trader who just sees “RSI is 75, sell” does not.
| Indicator | Primary Use | Crypto-Specific Quirk | Common Mistake |
|---|---|---|---|
| RSI (14-period) | Momentum & overbought/oversold | Volatility requires higher thresholds (80/20) | Selling at 70 without checking trend context |
| MACD (12, 26, 9) | Trend direction & momentum shifts | Frequent false crossovers on low timeframes | Trading every crossover on 5-min charts |
| RSI + MACD Combined | Confirmation of signals | Divergence on one indicator + crossover on other = higher probability | Ignoring conflicting signals |
The bottom line: RSI and MACD are essential because they answer two different questions — “How fast is price moving?” (RSI) and “What direction is the trend?” (MACD). Together, they give you a complete picture of market momentum. Without them, you’re trading blind.
Key Features to Look for in a Crypto Education App

Not all crypto education apps are created equal. Many are glorified dashboards with a “learn” tab bolted on. Here’s what separates genuine educational tools from noise in 2026.
Plain-Language Explanations (Not Jargon Dumps)
The #1 feature to look for: does the app explain why in simple terms? A chart that shows “RSI: 68” is useless if you don’t know what that means for your trade. The best apps — like Chartscope — use AI to translate indicator readings into plain language that a beginner can act on.
On-Device Processing for Privacy
Here’s a feature most people overlook: where does your data go? Many crypto apps upload your chart data, API keys, and trading history to cloud servers. Chartscope processes all AI analysis locally on your device using Apple’s Core ML framework — your market data is never sent to external AI servers, and no internet connection is required for AI features after initial setup.
This matters more than you think. If an app is free, your data is often the product. A crypto education app that collects zero personal data, uses no analytics, and runs no tracking scripts is rare.
Interactive Practice, Not Passive Videos
Watching a YouTube tutorial is passive learning. You need to practice on real charts. Look for apps that let you:
- Open a live chart
- Identify patterns yourself
- Get AI feedback on your analysis
- Ask follow-up questions in a conversational format
Chartscope’s AI Chat feature is context-aware — it knows your current coin and timeframe, and it answers multi-turn questions. That’s the difference between memorizing definitions and actually learning to read charts.
Multi-Language Support
If English isn’t your first language, technical analysis is hard enough without translation barriers. Chartscope supports 9 languages, making it accessible to non-native speakers who want to learn RSI and MACD without fighting a language barrier.
The Feature Comparison Table
| Feature | Why It Matters | Chartscope (per site docs) |
|---|---|---|
| AI Chart Explanation | Translates indicators into plain language | ✅ AI Chat + AI Vision |
| On-Device Processing | Keeps your data private | ✅ Core ML, zero cloud AI |
| Visual Pattern Recognition | Identifies candlesticks (Doji, Engulfing, etc.) | ✅ AI Vision feature |
| Structured Insights | Breaks down volatility, momentum, risk/reward | ✅ Insights v6 (9 cards) |
| No Trading Signals | Educational only, no hype | ✅ Explicitly stated |
| Free Trial | Test before committing | ✅ 3-day free trial, €4.99/month after |
| Multi-Language | Accessible to non-English speakers | ✅ 9 languages |
How to Practice Technical Analysis Using Chartscope Tools
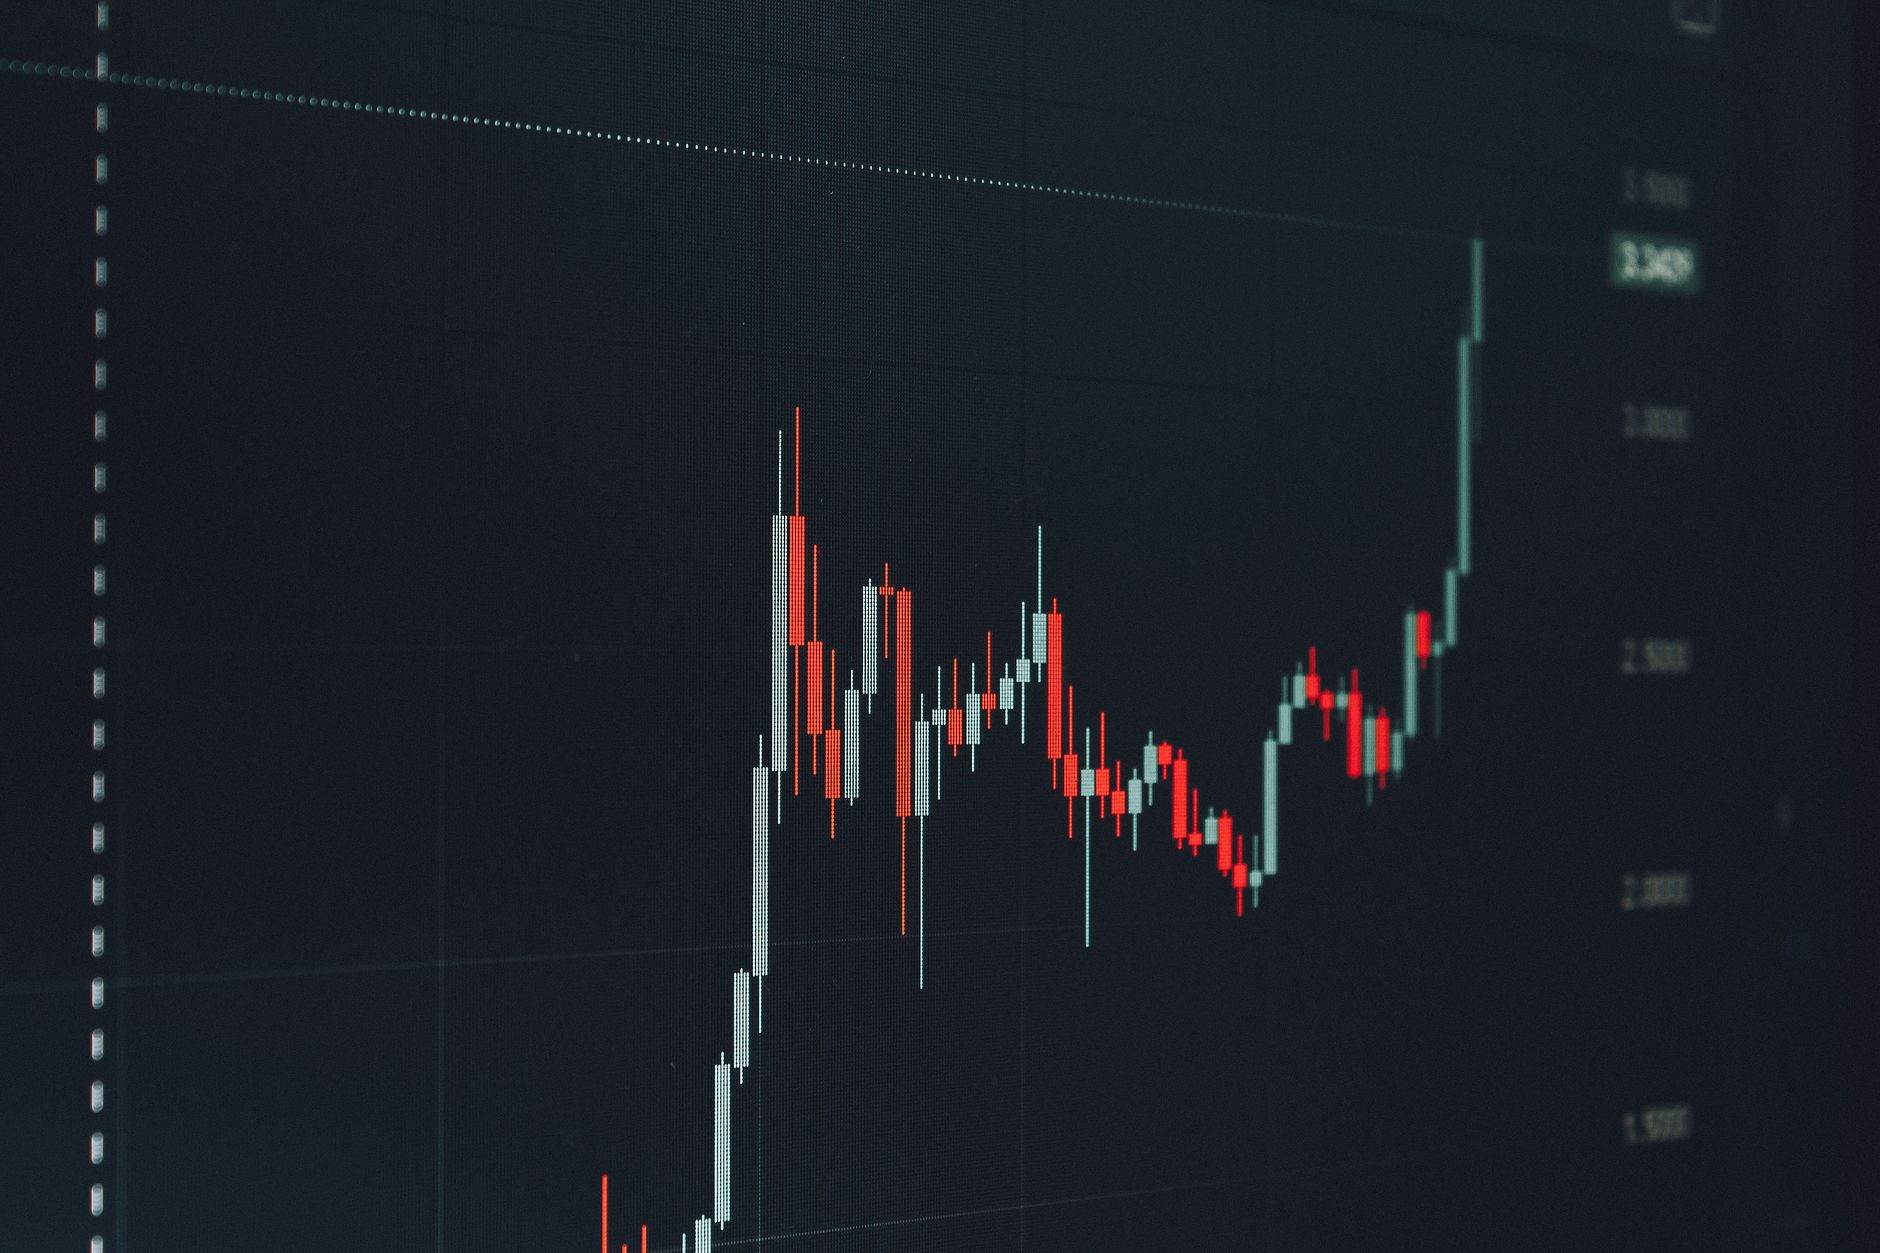
Theory without practice is useless. Here’s a step-by-step guide to actually learning RSI and MACD using Chartscope’s educational tools.
Step 1: Download and Start the Free Trial
Chartscope offers a 3-day free trial (€4.99/month after). Download it from the App Store — it requires iOS 16 or later. During the trial, you get access to all premium features including AI Chat, AI Vision, and Insights v6.
Step 2: Open a Chart and Enable AI Chat
Pick a coin you’re familiar with — Bitcoin or Ethereum are good starting points. Open the chart and ask the AI Chat a specific question like:
“Explain what the RSI is showing on this 4-hour Bitcoin chart.”
The AI responds in plain language, explaining the current RSI reading in the context of your chart. It never gives signals — it always explains why. This is the critical distinction: you’re learning to think, not being told what to buy.
Step 3: Use AI Vision for Pattern Recognition
Take a screenshot of a chart and use the AI Vision feature. The vision LLM reads your chart screenshot and identifies candlestick patterns like Doji, Engulfing, and Shooting Star formations. It confirms or enriches the text analysis.
This is where the learning compounds: you see a candlestick pattern on the chart, the AI names it, and then the text analysis explains what it means for momentum. Pattern recognition becomes second nature.
Step 4: Review the Insights Cards
Chartscope’s Insights v6 provides 9 structured cards covering: - Volatility - Indicator conflicts - Risk/Reward ratio - Market Mood (with a thermometer from 0-100) - Momentum and volatility context
Check the indicator conflict detection card. If RSI says overbought but MACD shows strong upward momentum, the AI flags this conflict and explains what it means. This is the “context beats memorization” principle in action.
Step 5: Ask Follow-Up Questions
The AI Chat is multi-turn. You can ask:
“Why is RSI showing divergence here even though price is rising?”
“What does the Market Mood reading of 72 mean for my position?”
Each answer builds on the previous one, creating a conversational learning loop. This is the fastest way to internalize technical analysis concepts.
Integrating Indicator Learning with Real-Time Market Data
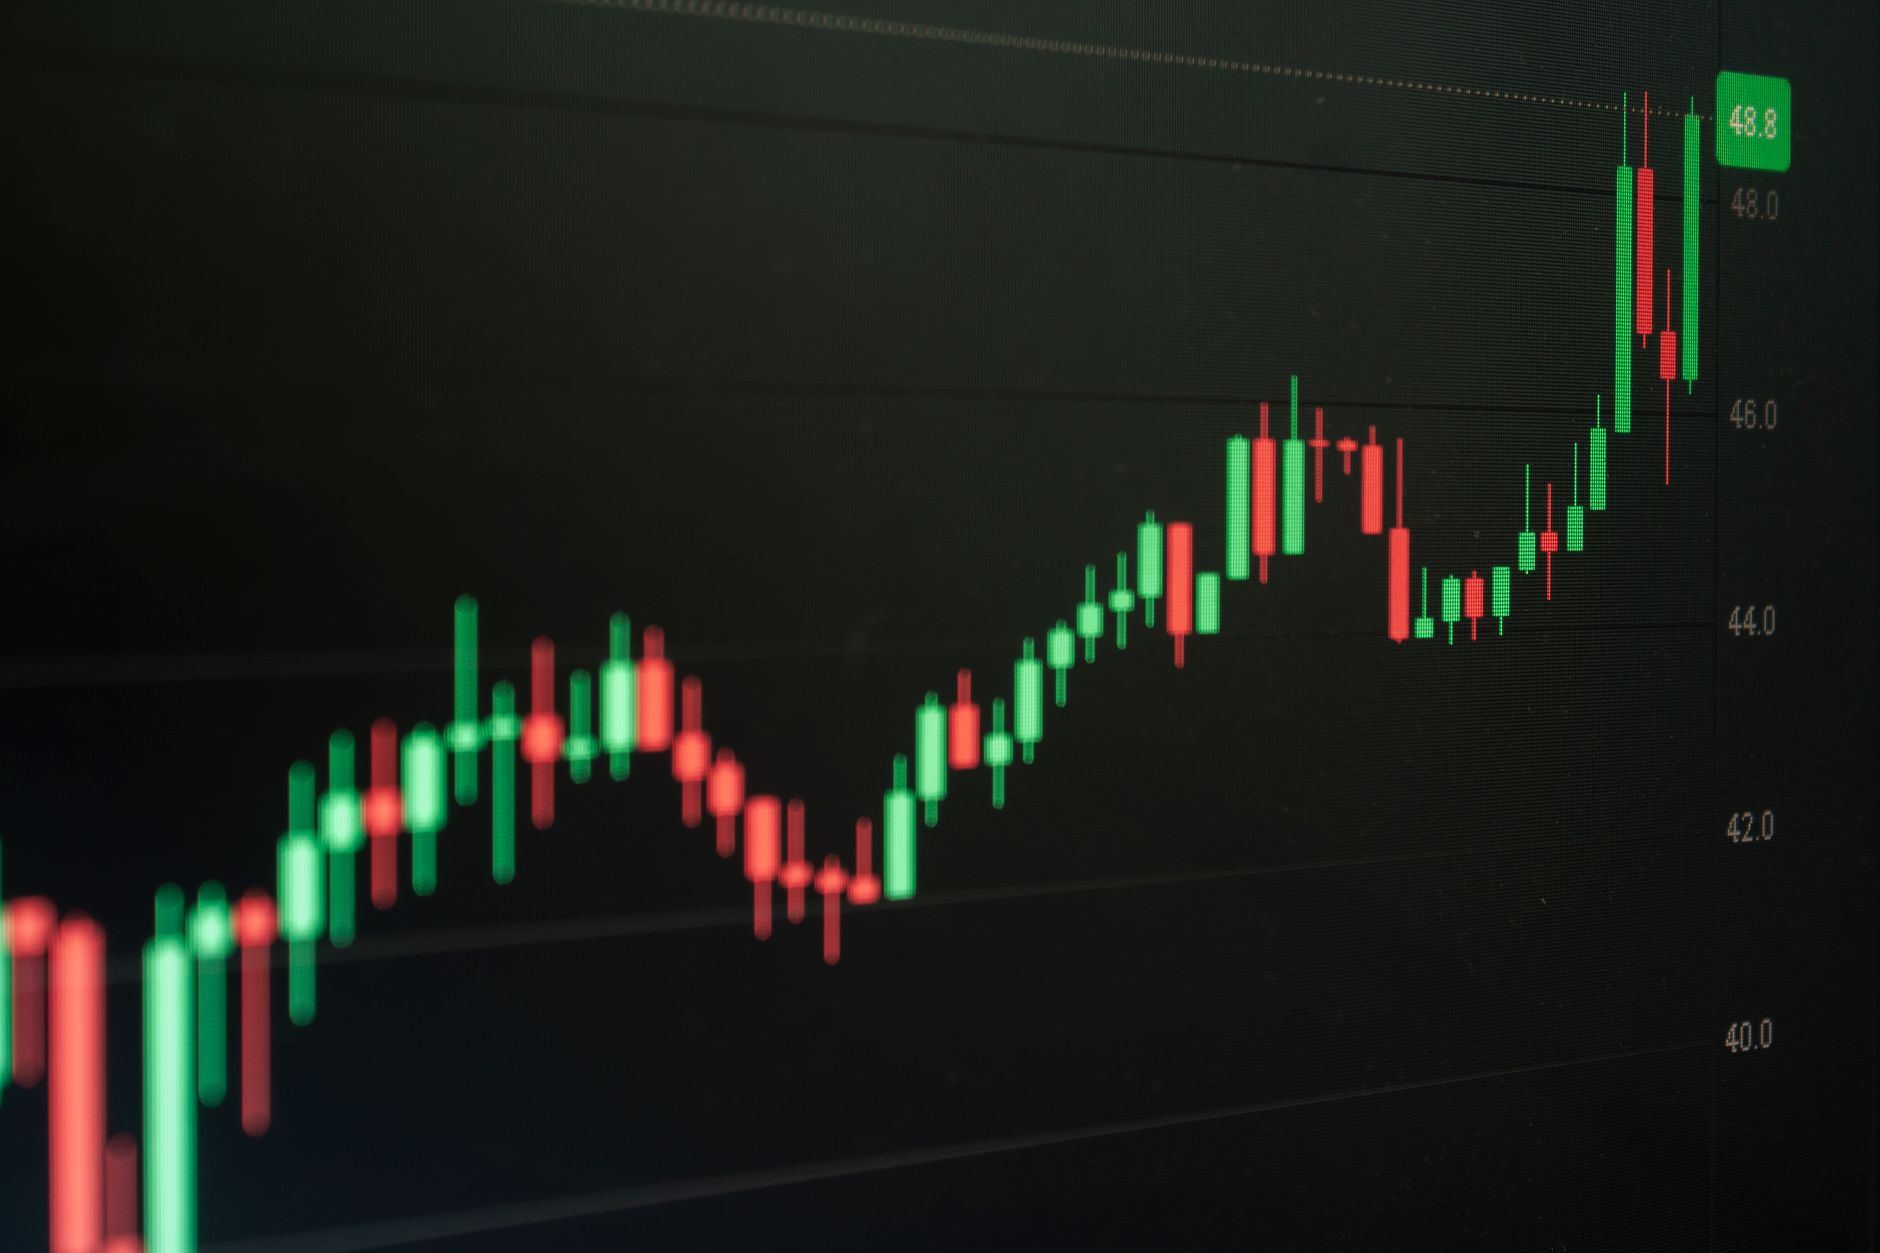
Learning RSI and MACD in isolation is like learning to swim on dry land. You need real-time market data to see these indicators behave in actual market conditions.
The On-Device Advantage
Most crypto apps send your chart data to cloud servers for analysis. Chartscope does the opposite: all AI processing happens locally on your device using Apple’s Core ML framework. The on-device ML performs trend classification on your iPhone’s Neural Engine with approximately 1ms inference time — and zero data is sent for ML processing.
What does this mean for you as a learner?
- Privacy: Your trading patterns and portfolio data never leave your device
- Speed: Instant analysis without waiting for server response
- Offline capability: AI features work without an internet connection after initial setup
Connecting Your Exchange (Optional)
Chartscope allows you to connect exchange accounts using API keys. Your keys are stored exclusively in the iOS Keychain with hardware-level encryption. Use only read-only API keys with restricted permissions — this is a best practice for any crypto tool.
The Learning Loop
Here’s how to integrate indicator learning with live data:
- Observe: Open a live chart and note what RSI and MACD are showing
- Ask: Query the AI Chat about the current readings
- Verify: Check the Insights cards for volatility and momentum context
- Predict: Form your own hypothesis about what might happen next
- Confirm: Wait and see if the market follows your analysis
This loop — observe, ask, verify, predict, confirm — is how professional traders learn. And it’s available for €4.99/month with a 3-day free trial. Start your free trial and see if it works for you →
Building a Consistent Trading Strategy in 2026
You’ve learned the indicators. You’ve practiced on live charts. Now it’s time to build a repeatable strategy — not a “get rich quick” scheme.
Define Your Timeframe First
RSI and MACD behave differently on different timeframes. A 15-minute chart produces dozens of signals per day — most of them false. A daily chart produces fewer signals but with higher reliability.
Beginners should start with the 4-hour or daily chart. This filters out market noise and makes it easier to see the cause-and-effect relationship between indicator movements and price action.
Create a Rule-Based Checklist
A consistent strategy requires rules. Here’s a checklist you can adapt:
- [ ] Trend filter: Is price above the 200 EMA? (Only take long signals)
- [ ] RSI confirmation: Is RSI between 40-60? (Neutral zone — no extreme readings)
- [ ] MACD alignment: Is MACD line above signal line? (Confirms trend direction)
- [ ] Divergence check: Is RSI diverging from price? (Reversal warning)
- [ ] Risk/Reward ratio: Is the potential gain at least 2x the potential loss?
- [ ] Market Mood check: What does the Market Mood thermometer say? (0-100 scale)
If all conditions align, you have a high-probability setup. If any condition contradicts, stand aside. Not trading is a valid position.
The 2026 Reality Check
Chartscope is designed for educational and informational purposes only — it does not provide financial advice, investment recommendations, or trading signals. Past performance does not guarantee future results, and cryptocurrency markets are highly volatile and speculative.
This isn’t a disclaimer to ignore — it’s a warning to respect. No indicator, no AI, and no app can predict the future. What RSI and MACD give you is probability, not certainty. A consistent strategy is one that accepts this and manages risk accordingly.
Track Your Progress
Keep a journal of every trade you take (or every setup you identify). Note: - What the indicators showed - What you decided - What happened - What you learned
Users who track their analysis consistently typically identify their own mistakes 2-3 weeks earlier than those who don’t. Your past analysis is your best teacher.
FAQ: Learning RSI and MACD for Crypto in 2026
Can I learn RSI and MACD indicators for free in 2026?
Yes. Chartscope offers a 3-day free trial that includes full access to AI Chat, AI Vision, and Insights features. After the trial, the app costs €4.99/month. There are also numerous free educational articles on the Chartscope blog, including how to interpret RSI and MACD signals in crypto trading. For a purely free option, you can learn the basics from general educational resources, but you’ll miss the interactive, chart-specific feedback that makes learning stick.
Why are RSI and MACD important for crypto trading?
RSI measures momentum and identifies overbought/oversold conditions, while MACD tracks trend direction and momentum shifts. Together, they answer two critical questions: “How fast is price moving?” and “What direction is the trend?” In crypto’s 24/7, highly volatile markets, these indicators help traders filter noise and identify higher-probability setups. They’re not predictive — they’re descriptive — but they provide the context needed to make informed decisions.
How do I start using Chartscope for technical analysis?
Download Chartscope from the App Store (requires iOS 16+), start the 3-day free trial, open a chart for your preferred coin, and ask the AI Chat to explain what RSI and MACD are showing. Use the AI Vision feature to identify candlestick patterns, and review the Insights cards for volatility, momentum, and risk/reward context. All processing happens on-device, so your data stays private.
Is Chartscope a trading signal app?
No. Chartscope explicitly states it provides no trading signals and no financial advice. Its purpose is educational: it explains what your chart is doing in plain language so you can learn to analyze markets yourself. The AI never tells you to buy or sell — it explains the why behind indicator readings.
Does Chartscope work without an internet connection?
Yes. AI features work without an internet connection after initial setup, since all processing happens locally on your device using Apple’s Core ML framework. You’ll need an internet connection to fetch real-time market data from exchanges, but the AI analysis itself runs entirely on-device.
Continue Learning
Ready to go deeper? Here are related articles to continue your technical analysis education:
- How to Interpret RSI and MACD Signals in Crypto Trading 2026
- How to Learn Crypto Trading: A Beginner’s Roadmap for 2026
- Free Course: Master RSI & MACD for Crypto Trading 2026
Stop memorizing definitions. Start understanding charts. Download Chartscope, use the 3-day free trial to ask your first question about RSI on a live Bitcoin chart, and experience what real technical analysis education feels like. Your future trading self will thank you.
Last updated: 2026-08-17