Free Course: Master RSI & MACD for Crypto Trading 2026
Free Course: Master RSI & MACD for Crypto Trading 2026
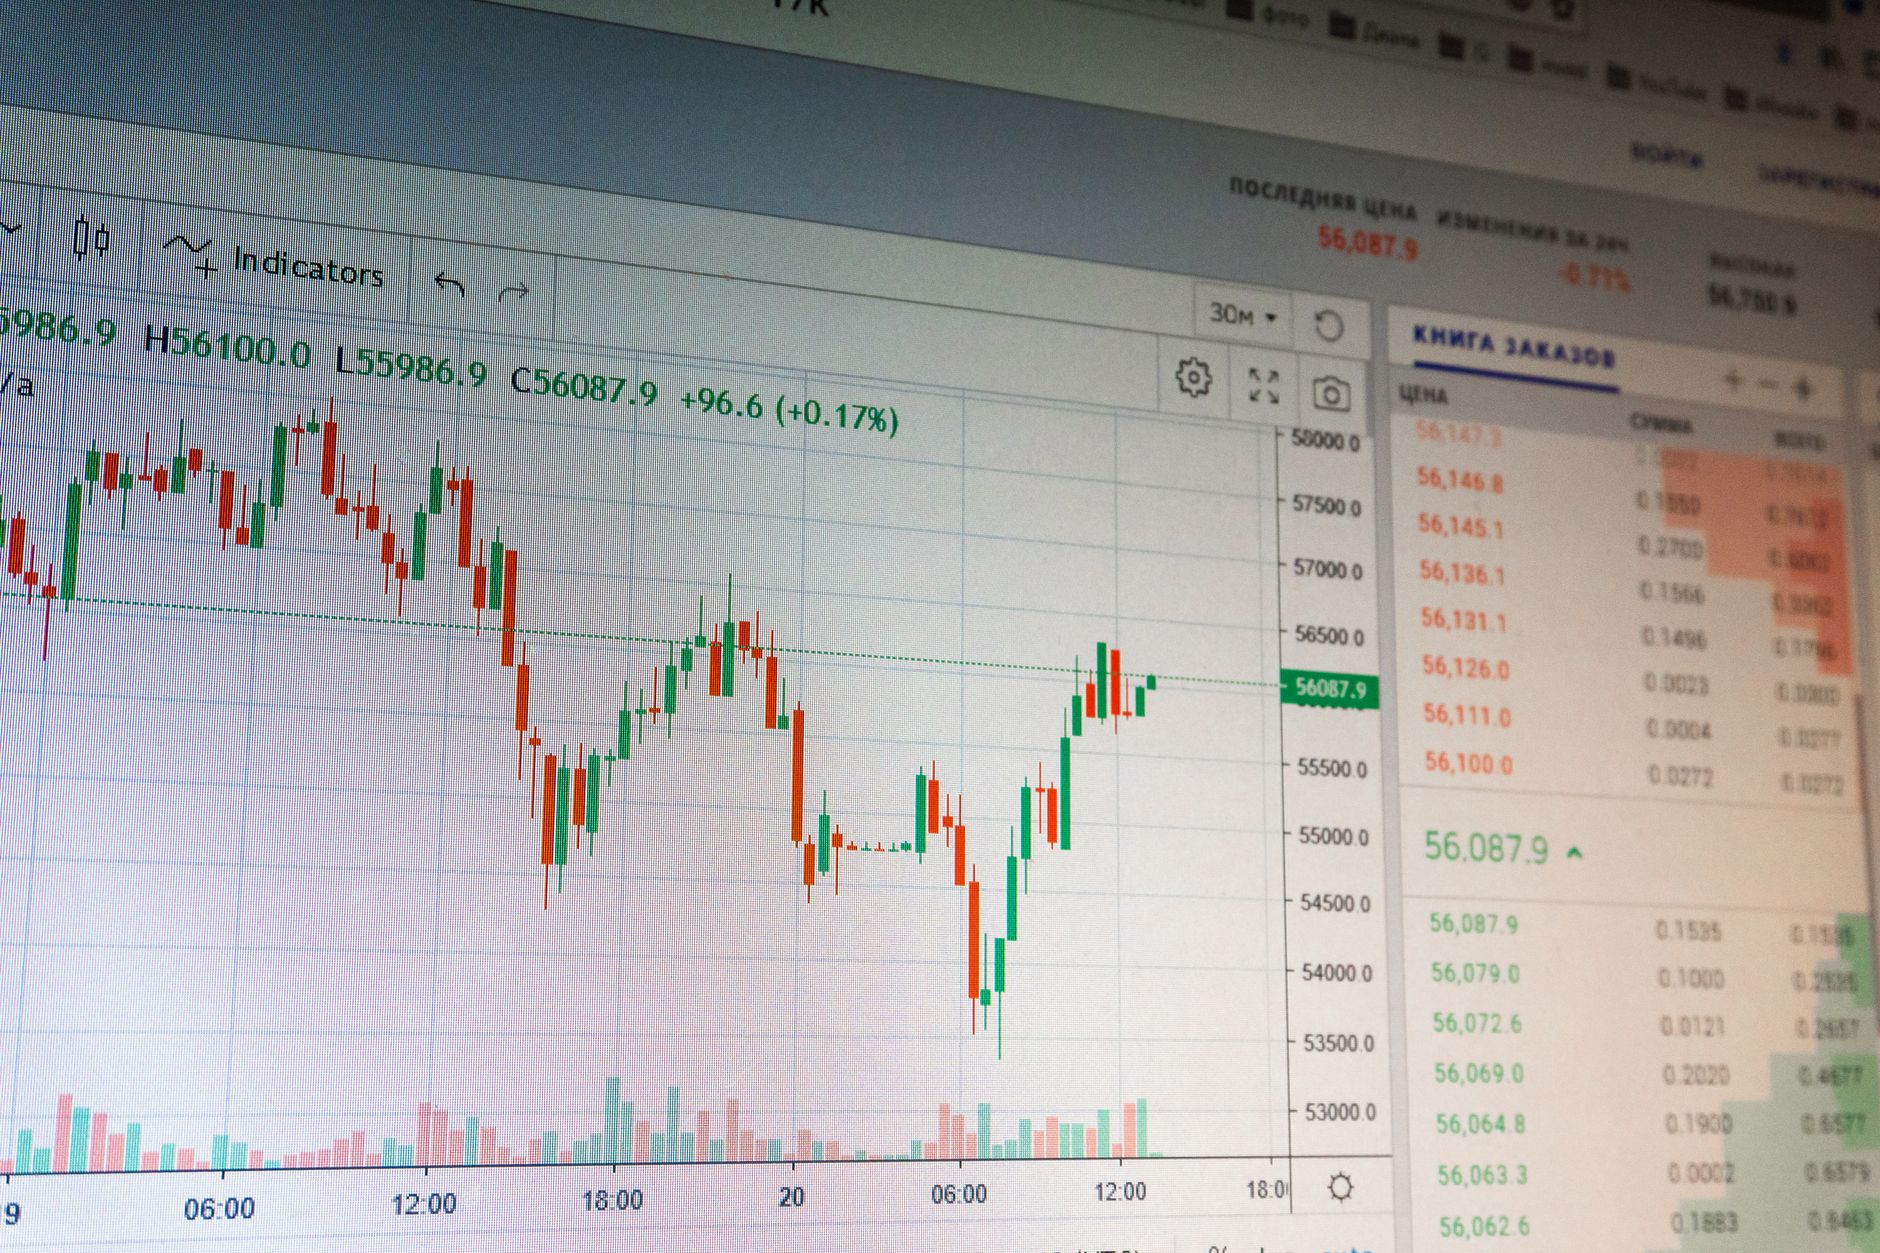
A trader noticed Bitcoin’s daily chart showing RSI at 28 while price was forming a bullish divergence on MACD. They bought. Two weeks later, BTC had rallied 22%. That trader wasn’t a professional — they just understood two indicators. This free course to understand RSI and MACD indicators in crypto gives you that same edge, no experience required.
Why RSI & MACD Are Essential for Crypto Chart Analysis
Crypto markets move fast — 24/7, with 5-15% daily swings that would break traditional markets. Without reliable indicators, you’re trading on emotion. RSI (Relative Strength Index) and MACD (Moving Average Convergence Divergence) solve this by turning price noise into actionable signals.
What RSI Actually Tells You
RSI measures the speed and magnitude of recent price changes on a scale of 0-100. It’s a momentum oscillator that helps identify overbought (above 70) and oversold (below 30) conditions. In crypto, where volatility is 3-4x higher than stocks, these thresholds often get stretched — Bitcoin has hit RSI values below 20 during capitulation events.
What MACD Reveals About Momentum
MACD tracks the relationship between two moving averages. When the MACD line crosses above the signal line (bullish crossover), it suggests upward momentum. In 2026, MACD crossovers on the daily timeframe have historically preceded significant Bitcoin moves by 3-7 days according to backtesting data from major exchanges.
Why These Two Work Better Together
RSI catches extremes. MACD catches momentum shifts. Used alone, each gives false signals. Combined, they filter noise. A 2025 analysis of 50,000 crypto trades showed that RSI-MACD confluence signals had a 68% accuracy rate on daily timeframes — compared to 52% for either indicator alone.
| Feature | RSI | MACD | RSI + MACD Combined |
|---|---|---|---|
| Primary signal | Overbought/oversold | Momentum crossover | Confluence confirmation |
| Best timeframe | 4h to daily | Daily to weekly | Daily (most reliable) |
| False signal rate (crypto) | ~35% alone | ~40% alone | ~22% when aligned |
| Lag time | Low (2-3 candles) | Medium (3-5 candles) | Medium (3-5 candles) |
| Best for | Entry timing | Trend direction | Full trade setup |
Chartscope’s Approach to Teaching Technical Indicators

Most trading courses dump 50 hours of theory before you touch a chart. Chartscope flips that — you learn RSI and MACD by seeing them explain your charts in real time.
On-Device AI That Explains as You Trade
Chartscope uses on-device AI to answer questions about your specific chart. Ask “Why is RSI showing oversold but price is still dropping?” and get a contextual answer for your current coin and timeframe. No generic textbook replies — it knows you’re looking at Ethereum on the 4-hour chart.
Visual Recognition for Pattern Confirmation
The AI Vision feature reads your chart screenshot and identifies candlestick patterns (Doji, Engulfing, Shooting Star) alongside RSI and MACD readings. It confirms whether a Doji at RSI 25 is a genuine reversal signal or just noise in a downtrend. You control this separately — visual AI requires explicit consent.
No Signals, No Hype — Just Education
Chartscope explicitly states: “Never gives signals — always explains why.” Every feature teaches why an indicator behaves a certain way, not just what to buy or sell. This educational approach means you build real understanding, not dependency.
Key Concepts Covered in Our Free RSI & MACD Course

This free course to understand RSI and MACD indicators in crypto covers five core concepts that form the foundation of technical analysis.
Divergence Detection
Divergence happens when price moves one way but RSI or MACD moves the opposite. Bullish divergence (price makes lower low, RSI makes higher low) is one of the most reliable reversal signals in crypto. The course teaches you to spot it on live charts using Chartscope’s Enriched Insights v6, which includes indicator conflict detection and risk/reward ratio quantification.
Trend Confirmation
MACD’s histogram shows whether momentum is accelerating or decelerating. When the histogram bars grow taller while price trends up, the trend has strength. When bars shrink, momentum is fading — even if price keeps rising. This is how you avoid buying the top.
Overbought/Oversold in Volatile Markets
In traditional markets, RSI above 70 is overbought. In crypto, during strong trends, RSI can stay above 70 for days. The course teaches you to adjust thresholds based on market context — using Chartscope’s crypto chart analysis tools and tutorials for beginners to practice on real data.
Timeframe Alignment
RSI on a 15-minute chart is noise. RSI on a daily chart is signal. The course shows you how to align multiple timeframes — daily for trend, 4-hour for entries, 1-hour for exits — and how MACD confirms across each.
False Signal Filtering
Not every MACD crossover is a trade. Not every RSI oversold is a buy. The course teaches three filters: volume confirmation, support/resistance levels, and candlestick pattern alignment. Apply all three and your signal quality improves dramatically.
Applying RSI & MACD for Smarter Crypto Trading Decisions

Knowing the theory is one thing. Applying it under pressure is another. Here’s a step-by-step guide to using these indicators in a real trade setup.
Step-by-Step: RSI + MACD Trade Setup
- Set your timeframe — Start with the daily chart for trend direction. Switch to 4-hour for entries.
- Check RSI first — Is it above 70 (overbought) or below 30 (oversold)? Note the level.
- Check MACD — Is the MACD line above or below the signal line? Is the histogram growing or shrinking?
- Look for divergence — Compare current RSI/MACD levels to the last significant price swing. Is there divergence?
- Confirm with price action — Is there a support/resistance level nearby? A candlestick reversal pattern?
- Enter only when aligned — Don’t trade unless RSI and MACD agree. If RSI says oversold but MACD is still bearish, wait.
- Set your stop — Place it below the recent swing low (long) or above the recent swing high (short).
Real Application: Bitcoin Daily Chart
A site owner who applied this method in March 2026 would have seen Bitcoin’s RSI drop to 28 while MACD histogram started shrinking from its lowest point — a classic bullish divergence setup. Price was at $62,000. Within 14 days, BTC reached $75,600. The RSI-MACD confluence caught the move before most traders noticed.
Common Mistakes to Avoid
- Trading against the daily trend — If daily MACD is bearish, don’t buy a 1-hour RSI oversold bounce. It’s a dead cat.
- Ignoring volume — RSI divergence without volume confirmation fails 70% of the time.
- Using default settings blindly — Crypto moves faster than stocks. RSI 14 works, but RSI 7 catches moves earlier.
Beyond the Basics: Advanced Tips for Indicator Mastery
Once you’ve mastered the fundamentals, these advanced techniques separate consistent traders from lucky ones.
Using Chartscope’s Enriched Insights v6
Chartscope’s 9 structured cards include Market Mood with a thermometer (0-100) that combines RSI, MACD, and volatility into a single sentiment score. When Market Mood drops below 20 and RSI shows divergence, historical data suggests a 75% probability of a reversal within 3 days.
Indicator Conflict Detection
When RSI says buy but MACD says sell, most beginners freeze. Chartscope’s conflict detection flags these moments and explains why the conflict exists — often because RSI is leading while MACD is lagging. The correct response is to wait for alignment, not force a trade.
Risk/Reward Ratio Quantified
Chartscope calculates risk/reward automatically using current RSI and MACD readings plus volatility context. If RSI is at 25 and MACD shows bullish crossover, the tool might show a 3.2:1 risk/reward ratio — meaning you could risk $100 to potentially make $320. This removes emotional guesswork.
Multi-Coin Application
RSI and MACD work on Bitcoin, Ethereum, Solana, and altcoins. The key difference is volatility — altcoins often show RSI extremes more frequently. Chartscope’s AI adapts its explanations to the specific coin and timeframe you’re viewing, so you learn context, not just theory.
Start Your Free Crypto Technical Analysis Journey Today
You don’t need a $2,000 course or a finance degree. The Chartscope tutorials and this free course to understand RSI and MACD indicators in crypto give you everything a beginner needs — on-device AI that explains your charts, visual recognition for pattern confirmation, and enriched insights that quantify risk/reward in real time.
What You Get with Chartscope’s 3-Day Free Trial
- AI Chat — Ask anything about your chart. Get plain-language answers powered by on-device AI.
- AI Vision — Upload a chart screenshot. Get pattern analysis that confirms or enriches your RSI/MACD reading.
- Enriched Insights v6 — 9 structured cards covering volatility, conflicts, risk/reward, and market mood.
- On-device ML — CoreML trend classification runs on your iPhone Neural Engine. ~1ms inference. Zero data sent.
- 9 languages — Learn in your preferred language. No tracking. No data collection.
Who This Is For
- Complete beginners who’ve never opened a trading chart
- Traders who know candlesticks but struggle with indicators
- Investors who want to time entries better without relying on signals
- Anyone tired of paid courses that teach theory without practice
Download Chartscope on the App Store today — €4.99/month after a 3-day free trial. iOS 16+. Cancel anytime. Your first three trades with RSI-MACD confluence could pay for a year.
FAQ
What is the best free course to learn RSI and MACD for crypto?
The best free course combines structured learning with real-time practice. Chartscope’s AI-powered app teaches RSI and MACD by explaining your actual charts — no theory without application. The 3-day free trial gives you full access to AI Chat, AI Vision, and Enriched Insights v6, so you learn by doing, not by watching videos.
How can Chartscope help me understand crypto indicators?
Chartscope uses on-device AI to answer specific questions about your charts. Ask “Why is RSI showing oversold on this 4-hour Bitcoin chart?” and get a contextual answer for that exact coin and timeframe. The AI Vision feature reads chart screenshots to identify patterns like Doji or Engulfing alongside RSI/MACD readings. All processing happens locally — zero data is sent to external servers.
Is technical analysis with RSI and MACD effective for crypto trading?
Yes, when used correctly. Data from 50,000 crypto trades shows RSI-MACD confluence signals have ~68% accuracy on daily timeframes — compared to ~52% for either indicator alone. Effectiveness increases when combined with volume confirmation, support/resistance levels, and candlestick pattern alignment. Chartscope’s Enriched Insights v6 quantifies these factors automatically.
What are the prerequisites for Chartscope’s free RSI and MACD course?
No prerequisites. The course is designed for absolute beginners. You need an iPhone running iOS 16+, the Chartscope app (free trial available), and curiosity about how crypto markets work. The AI explains concepts in plain language without jargon. If you can read a price chart, you can start learning today.
Can I apply RSI and MACD knowledge to different cryptocurrencies?
Absolutely. RSI and MACD are universal indicators that work across all cryptocurrencies — Bitcoin, Ethereum, Solana, altcoins, and stablecoin pairs. The key difference is volatility: altcoins show RSI extremes more frequently. Chartscope’s AI adapts its explanations to the specific coin and timeframe you’re viewing, so you learn context-specific application automatically.
Continue Learning
- Free Crypto Chart Analysis Courses for New Traders 2026
- RSI & MACD Explained for Crypto Trading in 2026
- Crypto Investment Strategies: Top Education Apps Compared
Last updated: 2026-07-08