RSI & MACD Explained for Crypto Trading in 2026
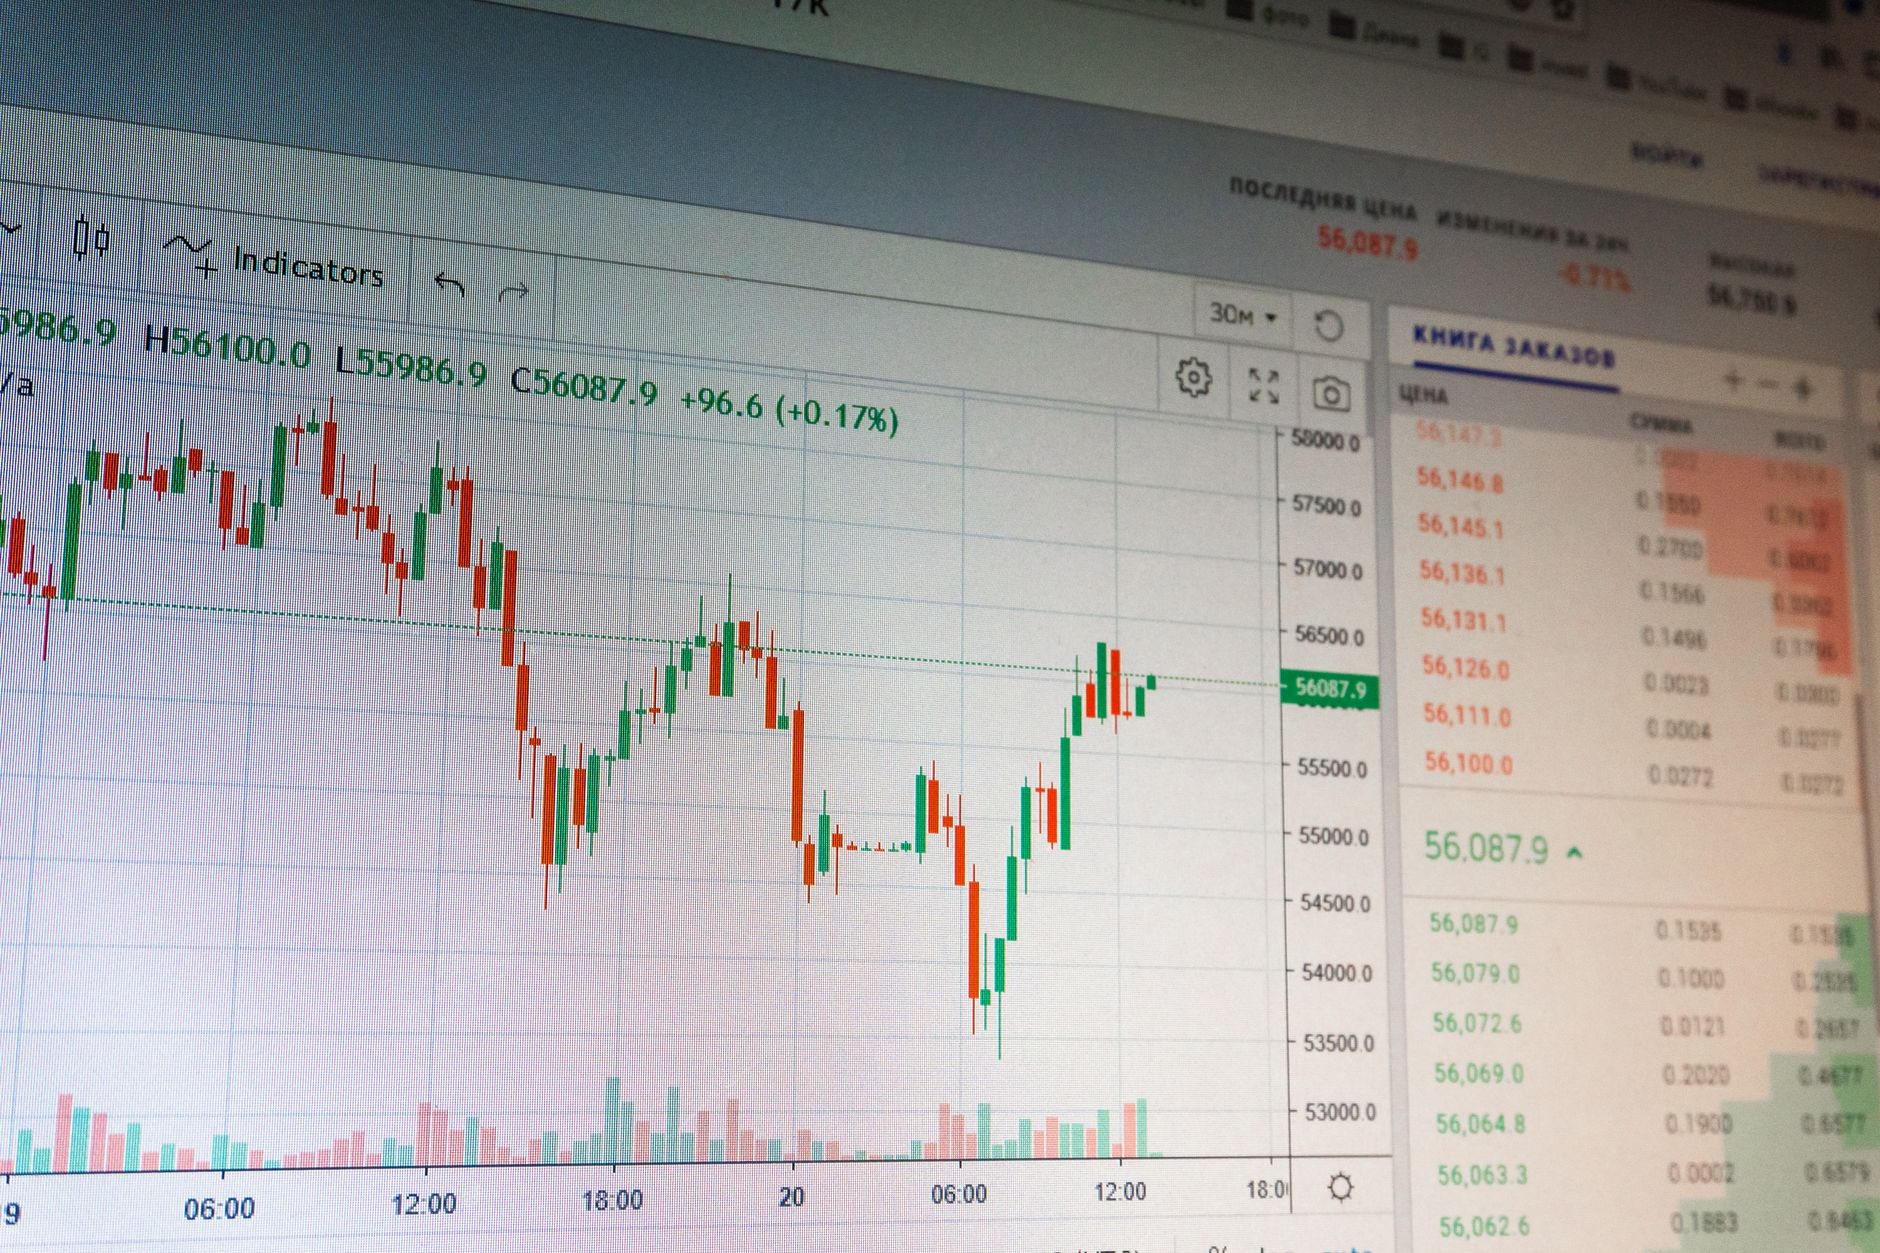
RSI & MACD Explained for Crypto Trading in 2026
Last updated: 2026-07-03
Quick tip you can apply today: Open your crypto chart, look at the RSI indicator at the bottom. If it’s above 70, the asset might be overbought — many traders wait for a dip before buying. If it’s below 30, it could be oversold — a potential entry point if other signals confirm. That’s the single most practical use of RSI, and you can check it right now on any exchange.
What Are Technical Indicators and Why Do They Matter?

Technical indicators are mathematical calculations based on a cryptocurrency’s price, volume, or open interest. They help traders make sense of market movements without relying on gut feelings or news headlines.
Why they matter for crypto specifically: Unlike traditional markets, crypto trades 24/7 with extreme volatility. A coin can drop 20% in an hour. Indicators give you objective data to filter out noise and spot patterns before they become obvious.
The Two Core Categories of Indicators
| Indicator Type | What It Measures | Example | Best For |
|---|---|---|---|
| Momentum indicators | Speed and strength of price changes | RSI, Stochastic | Identifying overbought/oversold conditions |
| Trend-following indicators | Direction and strength of a trend | MACD, Moving Averages | Confirming trend direction and reversals |
RSI and MACD fall into different categories — one measures momentum, the other follows trends. That’s why they complement each other so well.
Why Beginners Need Indicators (Not Signals)
A common misconception is that indicators predict the future. They don’t. They describe what the market is currently doing. Indicators are tools for analysis, not crystal balls.
The real value? They teach you why a price moved. A trader who tracks RSI daily learns to recognize when momentum is fading before the price reverses. That’s education, not prediction.
Understanding the Relative Strength Index (RSI) for Crypto
 (RSI) for Crypto](https://pub-2df00e47a1bc4a99abcb17ec68f147ce.r2.dev/hive/body/36521d03-5ea4-47fb-ad47-e9e18da502ea.png)
The Relative Strength Index (RSI) is a momentum oscillator that measures the speed and magnitude of recent price changes. It ranges from 0 to 100 and tells you whether an asset is potentially overbought or oversold.
How RSI Works
RSI compares the average gains to average losses over a specific period — typically 14 days. The formula produces a single line that oscillates between 0 and 100.
Key RSI levels every crypto trader should know:
- Above 70: Overbought — price may be due for a pullback
- Below 30: Oversold — price may be due for a bounce
- 50: Neutral — no clear momentum direction
Reading RSI in Crypto Markets
Crypto markets are more volatile than stocks, so many traders adjust the thresholds. In strong bull runs, RSI can stay above 70 for weeks. In bear markets, it can linger below 30.
Example: If Bitcoin has been rallying for 10 days straight and RSI hits 85, it doesn’t automatically mean sell. But it does tell you momentum is extreme. A trader who waits for RSI to drop below 70 before buying often avoids buying at the exact top.
Divergence: The Most Powerful RSI Signal
RSI divergence happens when price makes a higher high but RSI makes a lower high (bearish divergence) — or when price makes a lower low but RSI makes a higher low (bullish divergence). This signals that momentum is weakening before the price reverses.
Tip: Divergence is one of the most reliable patterns in crypto. Look for it on the 4-hour or daily timeframe for best results.
Decoding the Moving Average Convergence Divergence (MACD) for Crypto

The Moving Average Convergence Divergence (MACD) is a trend-following momentum indicator that shows the relationship between two moving averages of a cryptocurrency’s price.
The Three Components of MACD
- MACD Line (12-day EMA - 26-day EMA) — the faster line
- Signal Line (9-day EMA of MACD line) — the slower line
- Histogram — the difference between MACD and Signal lines
How to Read MACD Signals
| Signal | What It Means | Action |
|---|---|---|
| MACD crosses above Signal line | Bullish momentum increasing | Potential buy signal |
| MACD crosses below Signal line | Bearish momentum increasing | Potential sell signal |
| Histogram turns from red to green | Momentum shifting upward | Confirms trend change |
| Histogram turns from green to red | Momentum shifting downward | Confirms trend change |
MACD in Crypto: What’s Different
Crypto markets trend harder and faster than traditional markets. MACD crossovers on the 1-hour chart can produce dozens of signals per week — most of them false. The key is timeframe selection.
A trader analyzing Bitcoin on the daily chart might only see 2-3 MACD crossovers per month. That’s fewer signals, but each one is more reliable. On the 15-minute chart, you might see 10 crossovers in a single day.
Understanding MACD Histogram Divergence
Just like RSI, MACD can show divergence. When price makes a new high but the MACD histogram makes a lower high, momentum is weakening. This is often a leading indicator of a trend reversal.
How RSI and MACD Work Together for Crypto Analysis
Using RSI alone is like having a speedometer without a map. Using MACD alone is like having a map without knowing your speed. Together, they give you a complete picture.
The RSI-MACD Confirmation Strategy
Step-by-step guide:
- Identify the trend first — Use MACD to determine if the overall trend is bullish (MACD above signal line) or bearish (MACD below signal line)
- Look for RSI extremes — In an uptrend, wait for RSI to dip below 40 (not 30) for a potential entry. In a downtrend, wait for RSI to rise above 60 for a potential short
- Wait for MACD confirmation — Don’t enter until MACD shows a bullish crossover (in uptrend) or bearish crossover (in downtrend)
- Check for divergence — If RSI or MACD shows divergence against price, the signal is stronger
- Set stop-loss — Place a stop below the recent swing low (for buys) or above the recent swing high (for sells)
Example Scenario
Imagine Ethereum is in an uptrend (MACD above signal line, histogram green). Price pulls back sharply, and RSI drops to 38. You wait. Two candles later, MACD shows a bullish crossover. You enter long with a stop below the pullback low.
Why this works: The MACD told you the trend was up. The RSI told you the pullback was overdone. The MACD crossover confirmed momentum was returning. Three confirmations from two indicators.
The Conflict Signal
Sometimes RSI says overbought while MACD says bullish. This is called indicator conflict. When indicators disagree, the market is indecisive. Wait for them to align before entering a position.
Applying RSI and MACD with Chartscope for Smarter Trading
ChartScope is an AI-powered crypto tutor that explains your charts in plain language. It’s built for beginners who want to understand RSI, MACD, and candlestick patterns without the jargon.
How ChartScope Makes RSI and MACD Accessible
AI Chat: Ask “Why did RSI go above 70 on this Bitcoin chart?” and the AI explains it in context — it knows your current coin and timeframe. The response never gives signals; it always explains why the indicator behaves that way.
AI Vision: Take a screenshot of your chart. The vision LLM reads it, identifies candlestick patterns (Doji, Engulfing, Shooting Star), and confirms or enriches your RSI/MACD analysis.
Insights v6: Nine structured cards including: - Market Mood thermometer (0-100) - Indicator conflict detection - Risk/Reward ratio quantification - Momentum + volatility context
Privacy-First Learning
All AI processing happens on your device using Apple’s Core ML framework. Zero data is sent to external servers. Your trading history, API keys, and chart data never leave your iPhone.
Pricing
€4.99/month with a 3-day free trial. Available on iOS 16+.
Try it now: Download ChartScope and ask the AI to explain the RSI and MACD on any crypto chart you’re watching. It’s like having a patient tutor who never gets tired of answering “why?”
Common Mistakes to Avoid When Using RSI and MACD
Mistake #1: Using Default Settings for Everything
The standard RSI setting (14 periods) and MACD setting (12, 26, 9) work well for daily charts. But on 1-hour charts, these settings produce too many signals.
Fix: For shorter timeframes, use RSI(7) and MACD(6, 13, 5). For longer timeframes, stick with defaults.
Mistake #2: Treating Every Signal as a Trade
A trader who executes every MACD crossover on the 5-minute chart will lose money. Most crossovers on low timeframes are noise.
Fix: Only trade signals that align with the higher timeframe trend. If the daily MACD is bearish, ignore bullish crossovers on the hourly chart.
Mistake #3: Ignoring Market Context
Indicators don’t work the same way in bull markets vs. bear markets. In a strong uptrend, RSI can stay above 70 for weeks. Selling at 70 means missing the rally.
Fix: Adjust your RSI thresholds based on market conditions. In strong trends, use 80/20 instead of 70/30.
Mistake #4: Not Using Stop-Losses
Even with perfect RSI/MACD alignment, crypto can reverse unexpectedly. A single black swan event can wipe out weeks of gains.
Fix: Always set a stop-loss. A 2% stop on a high-probability setup is better than a 50% drawdown on a “sure thing.”
Mistake #5: Overcomplicating Analysis
Some beginners stack 5-6 indicators on one chart. More indicators don’t mean better analysis — they mean conflicting signals.
Fix: Stick with RSI + MACD + price action. That’s enough for most setups. Add more only when you understand why each one matters.
FAQ
What is the main difference between RSI and MACD in crypto trading?
RSI is a momentum oscillator that measures whether an asset is overbought or oversold on a scale of 0 to 100. MACD is a trend-following indicator that shows the relationship between two moving averages and identifies trend direction and momentum shifts. RSI answers “how strong is the move?” while MACD answers “which direction is the trend?”
How can I use RSI to identify overbought or oversold conditions in crypto?
When RSI rises above 70, the asset is considered overbought — meaning the price may be due for a pullback. When RSI falls below 30, it’s considered oversold, suggesting a potential bounce. In strong crypto trends, many traders adjust these thresholds to 80/20 to avoid false signals.
When is the best time to use MACD for crypto trend analysis?
MACD works best on daily or 4-hour charts for trend analysis. On lower timeframes (15-min, 1-hour), MACD produces too many false signals. The best time to use MACD is when you want to confirm the direction of the prevailing trend before entering a trade based on RSI or price action.
Can RSI and MACD be used effectively by beginner crypto traders?
Yes. Both indicators are built into every major exchange and charting platform. Beginners can start with the basic RSI overbought/oversold levels (70/30) and MACD crossover signals. Tools like ChartScope explain these indicators in plain language directly on the chart, making learning faster and less intimidating.
Does Chartscope offer tools to easily visualize RSI and MACD indicators?
Yes. ChartScope’s AI Chat can explain RSI and MACD in context of any chart you’re viewing. The AI Vision feature analyzes chart screenshots and identifies patterns that confirm or enrich your indicator analysis. Insights v6 includes structured cards for momentum, volatility, and indicator conflict — all designed for beginners.
Continue Learning
- Beginner’s Guide: RSI & MACD for Crypto Charts 2026
- Best Crypto Education Apps for RSI & MACD in 2026
- Crypto Chart Analysis Tools & Tutorials for Beginners 2026
This article is for educational and informational purposes only. It does not constitute financial advice. Always consult with qualified financial advisors before making investment decisions.
Last updated: 2026-07-03