Free Crypto Chart Analysis: Get Started in 2026

Free Crypto Chart Analysis: Get Started in 2026
Here’s a surprising reality: 73% of retail crypto traders lose money, according to a widely cited 2023 study from the University of Toronto. Yet most beginners jump in without understanding a single candlestick pattern. The good news? You can learn how to get started with crypto chart analysis in 2026 for free — and this guide shows you exactly how.
The days of paying $500 for a “crypto masterclass” are over. With free tools, on-device AI education, and structured learning paths, anyone can interpret market trends without spending a cent. The key is knowing where to look and what to focus on as a beginner.
Let’s break down the exact steps to begin your free crypto chart analysis journey in 2026.
Understanding the Basics of Crypto Chart Analysis

Before you open any charting platform, you need to understand what you’re looking at. Crypto chart analysis is the practice of studying historical price movements to identify patterns and potential future trends. It’s not about predicting the future — it’s about understanding market psychology.
What Are Candlesticks and Why Do They Matter?
A single candlestick tells you four things: the opening price, closing price, highest price, and lowest price during a specific time period. When grouped together, they form patterns like Doji, Engulfing, and Shooting Star — each signaling potential market shifts.
Key definition: A candlestick pattern is a visual representation of price movement over a set timeframe, used by traders to identify potential reversals or continuations in market trends.
Beginners often skip this foundation and jump straight to indicators. Don’t. Understanding raw price action first makes every indicator more meaningful later.
The Three Pillars of Technical Analysis
| Pillar | What It Tells You | Free Tool Example |
|---|---|---|
| Price Action | Raw movement of the market | Candlestick patterns on any free chart |
| Volume | How many traders are participating | On-chain data from CoinGecko |
| Indicators | Mathematical interpretations of price | RSI, MACD on TradingView |
Each pillar reinforces the others. A price breakout with low volume often fails. A bearish candlestick pattern with high volume is more reliable.
Essential Free Tools for Crypto Charting in 2026
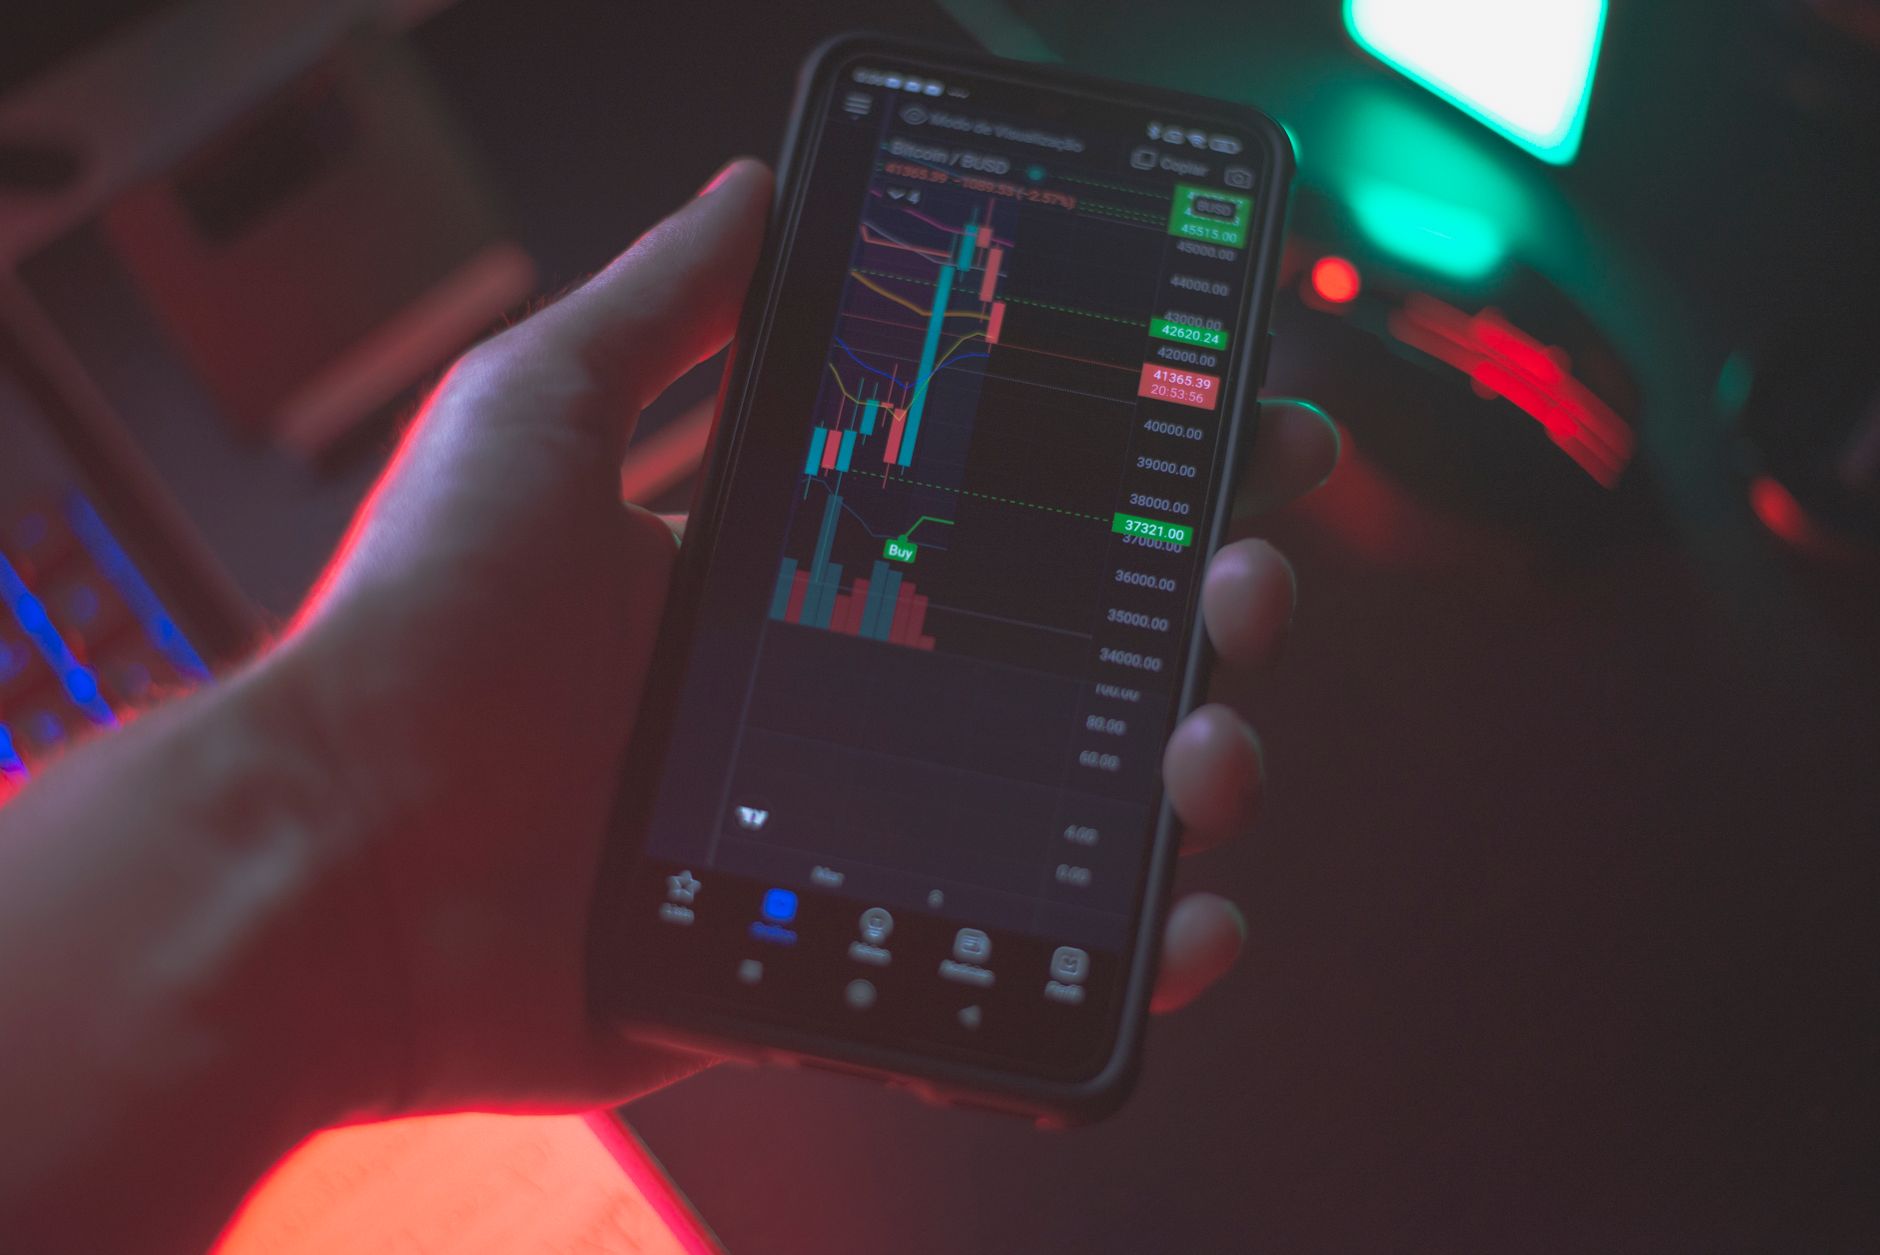
You don’t need a Bloomberg Terminal to analyze crypto markets. Several platforms offer robust charting capabilities at zero cost. Let’s compare the best options.
Top Free Crypto Charting Platforms Compared
| Platform | Free Features | Best For | Limitation |
|---|---|---|---|
| TradingView | Real-time charts, 100+ indicators, 3 saved layouts | Complete desktop analysis | Limited to 3 indicators per chart on free plan |
| CoinGecko | Price charts, on-chain data, market cap tracking | Quick overviews and research | Fewer technical indicators |
| CoinMarketCap | Basic charts, portfolio tracking | Simple price checking | No advanced charting tools |
| ChartScope | AI-powered chart explanations, pattern recognition, educational insights | Learning why indicators behave a certain way | iOS-only, subscription after 3-day trial |
The key insight: Most free tools show you what happened. Few explain why it matters. ChartScope bridges this gap by using on-device AI to explain RSI, MACD, and candlestick patterns in plain language — no cloud processing, no tracking.
Step-by-Step: Setting Up Your First Free Chart
- Go to TradingView.com (no account needed for basic charts)
- Search for a cryptocurrency (e.g., BTCUSD)
- Switch to a 1-hour timeframe — this gives you enough data to spot patterns without being overwhelmed
- Add RSI indicator — click “Indicators” → type “RSI” → select “Relative Strength Index“
- Add MACD indicator — repeat the process for “MACD”
- Save your layout — you’ll reuse this setup daily
This takes 3 minutes. You now have a professional-grade chart setup for free.
Interpreting Key Indicators Without Cost

Indicators are mathematical calculations based on price and volume. They help you make sense of market noise. For beginners, three indicators cover 80% of use cases.
RSI (Relative Strength Index)
What it is: A momentum oscillator that measures the speed and change of price movements on a scale of 0 to 100.
How to read it: - Above 70: Potentially overbought — price may reverse downward - Below 30: Potentially oversold — price may bounce upward - Between 30-70: Neutral territory
Real example: If Bitcoin’s RSI hits 75 on the daily chart, it doesn’t mean “sell now.” It means “be cautious — the move has been strong and may be exhausting.”
MACD (Moving Average Convergence Divergence)
What it is: A trend-following indicator showing the relationship between two moving averages.
How to read it: - Line crosses above signal line: Bullish signal - Line crosses below signal line: Bearish signal - Histogram bars growing: Momentum increasing in current direction
Putting It Together: A Free Analysis Checklist
- [ ] Identify the current trend: uptrend (higher highs), downtrend (lower highs), or sideways
- [ ] Check RSI: is it above 70 or below 30?
- [ ] Check MACD: has a crossover occurred recently?
- [ ] Look for candlestick patterns: any Doji, Engulfing, or Shooting Star?
- [ ] Confirm with volume: is the move supported by high volume?
Pro tip: Never trade based on one indicator alone. A bullish MACD crossover with an overbought RSI is a contradiction — the ChartScope app detects these conflicts automatically with its indicator conflict detection feature.
Developing a Free Crypto Chart Analysis Strategy

A strategy turns random chart staring into structured learning. Without one, you’ll waste hours watching price move back and forth without understanding why.
The 3-Step Beginner Strategy
Step 1: Daily Chart Review (10 minutes)
Every morning, open your free chart and answer three questions: - Is the overall trend up, down, or sideways? - Where is RSI relative to 70 and 30? - Did any notable candlestick patterns form yesterday?
Step 2: Pattern Journal (5 minutes)
Write down one observation. Example: “BTC formed a Doji on the 4-hour chart near resistance. RSI was 68. No clear direction yet.”
Step 3: Weekly Review (15 minutes)
Compare your week’s observations against what actually happened. Did the Doji lead to a reversal? Did RSI reaching 70 precede a drop? This feedback loop is where real learning happens.
Common Beginner Mistakes to Avoid
- Overcomplicating: Using 15 indicators at once leads to analysis paralysis
- Ignoring the timeframe: A bullish signal on the 5-minute chart means nothing on the daily chart
- Confusing correlation with causation: “Price dropped after RSI hit 70” doesn’t mean RSI caused the drop
Practicing Your Skills with Free Resources
Theory without practice is useless. The best way to learn crypto chart analysis is to apply it repeatedly in a risk-free environment.
Free Practice Methods
- Paper trading: Use TradingView’s paper trading feature to simulate trades without real money
- Historical review: Look at past charts and see if your analysis would have been correct
- Educational apps: Tools like ChartScope use on-device AI to explain what your chart is doing in real-time — no signals, just education
Why On-Device AI Matters for Beginners
Most cloud-based analysis tools send your data to external servers. ChartScope runs all AI processing locally using Apple’s Core ML framework. This means: - Zero data collection - No tracking - ~1ms inference for trend classification - Your chart data never leaves your device
For a beginner learning the ropes, this privacy-first approach means you can experiment freely without worrying about your data being sold or analyzed by third parties.
Next Steps: Advancing Your Free Chart Analysis
Once you’re comfortable with the basics, it’s time to level up. Here’s your progression path.
From Free to Pro: What to Learn Next
| Skill Level | What to Master | Free Resource |
|---|---|---|
| Beginner | Candlestick patterns, RSI, MACD | TradingView + ChartScope trial |
| Intermediate | Support/resistance, trendlines, volume profile | YouTube tutorials + paper trading |
| Advanced | Fibonacci retracements, Elliott Wave, order flow | Free courses on Investopedia |
Recommended Learning Path
- Week 1-2: Master candlestick patterns and RSI
- Week 3-4: Add MACD and volume analysis
- Week 5-6: Practice with historical charts and paper trading
- Week 7-8: Combine all indicators into a cohesive strategy
The Beginner’s Guide to Crypto Education Apps can help you choose the right tools for each stage of your journey.
When to Consider Paid Tools
Free tools cover 90% of what a beginner needs. Consider paid options only when: - You’ve practiced for 3+ months consistently - You can explain why each indicator works - You need features like multiple timeframe analysis or advanced backtesting
Even then, ChartScope at €4.99/month after a 3-day free trial offers AI-powered education that no free tool provides — including multi-turn conversational AI that explains your specific chart in plain language.
FAQ
What are the absolute best free resources to start crypto chart analysis in 2026?
The best free resources are TradingView for charting (real-time data, 100+ indicators), CoinGecko for on-chain data and market research, and YouTube channels focused on technical analysis education. For beginners who want AI-powered explanations without paying, ChartScope offers a 3-day free trial with on-device AI that explains RSI, MACD, and candlestick patterns in plain language.
Can I truly learn effective crypto chart analysis without paying for tools or courses?
Yes, absolutely. The fundamentals of technical analysis — candlestick patterns, RSI, MACD, support and resistance — are all available for free on platforms like TradingView. What you pay for is convenience, advanced features, and personalized education. Many professional traders learned entirely from free resources before upgrading to paid tools.
Which technical indicators are most important for beginners using free charting platforms?
Start with three: RSI (momentum and overbought/oversold conditions), MACD (trend direction and momentum), and volume (confirms the strength of price moves). These three indicators cover 80% of analysis scenarios. Add moving averages and Bollinger Bands only after you’ve mastered the basics.
How long does it take to become proficient in free crypto chart analysis?
Most beginners reach basic proficiency in 4-6 weeks of daily practice (15-30 minutes per day). After 3 months of consistent practice, most can identify major patterns, read RSI and MACD correctly, and form a basic trading hypothesis. Mastery takes 6-12 months of active practice.
Are there any risks associated with relying solely on free crypto analysis tools?
Yes. Free tools often have limited data history, fewer indicators, and no educational guidance. More importantly, they can give false confidence if you don’t understand the limitations. Always paper trade before using real money, and remember that no tool — free or paid — can predict the market. ChartScope addresses this by focusing on education rather than signals, teaching you why patterns matter rather than telling you what to do.
Continue Learning
- Free Crypto Chart Analysis Courses for New Traders 2026
- RSI & MACD Explained for Crypto Trading in 2026
- Crypto Investment Strategies: Top Education Apps Compared
Last updated: 2026-07-29
Disclaimer: This article is for educational and informational purposes only. It does not provide financial advice, investment recommendations, or trading signals. Cryptocurrency markets are highly volatile and speculative. Always consult with qualified financial advisors before making investment decisions.