Understanding Crypto Volatility & German Regulations 2026
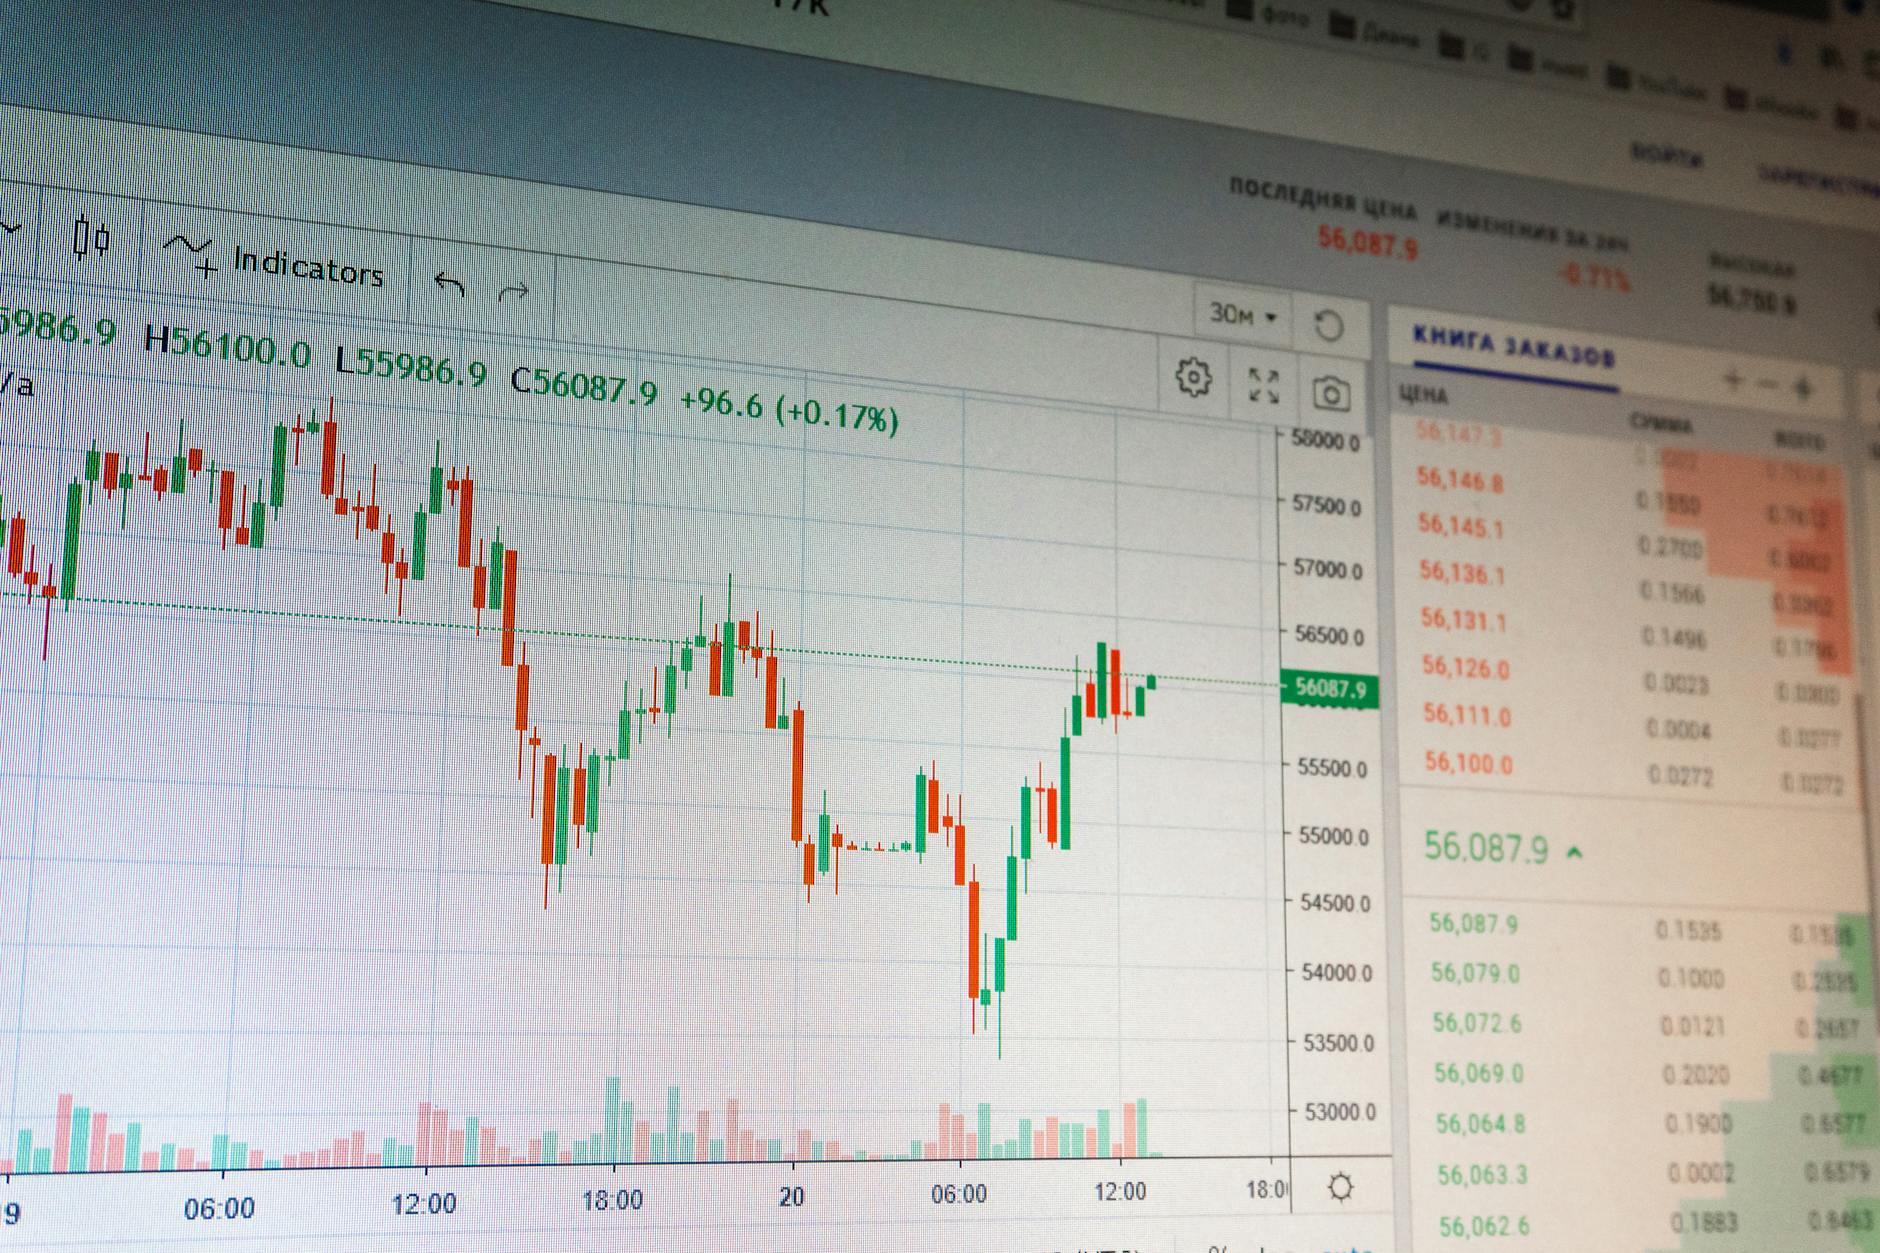
Here’s an actionable tip you can apply today: Set a 15‑minute timer and review the last Bitcoin daily chart on your phone. Look for a single Doji candlestick pattern—where the open and close are nearly equal. A Doji near a recent high or low often signals market indecision and a possible reversal, giving you a concrete glimpse of crypto market fluctuations without any software.
What is cryptocurrency volatility and why does it matter?
Cryptocurrency volatility measures how quickly and how far prices move within a given period. In 2025 Bitcoin’s average daily volatility was 3.5 % (CoinMetrics, 2025)¹, versus roughly 0.8 % for the S&P 500 (Bloomberg, 2025)². High volatility means a 15 % crash can erase weeks of gains in minutes, directly affecting portfolio value and investor psychology.
The three drivers of crypto volatility
- Market sentiment & news – Regulatory announcements (e.g., Germany’s 2026 blockchain framework), exchange hacks, or high‑profile tweets can shift prices instantly.
- Liquidity depth – Thin order books on low‑cap tokens amplify price moves; a single large sell order can drop a token by 30 % in seconds.
- Leverage & liquidations – Borrowed‑money positions force cascades; a June 2025 liquidation event erased $1.2 bn in long positions across major exchanges³.
“Volatility is the price of uncertainty; understanding its sources is the first step to managing risk.” – Prof. Dr. Philipp Sandner, Head of the Frankfurt School‑Blockchain Center, 2026.
How do German crypto regulations affect beginners?
Germany treats most crypto assets as “financial instruments” under the Banking Act (KWG), meaning exchanges and custodians must hold a BaFin license and comply with strict KYC/AML rules ⁴. For individual learners, these rules act as a safety net: any platform you connect to is audited for security and transparency, letting you focus on chart education without regulatory worries.
| Regulation | What it means for you | Effective since |
|---|---|---|
| MiCAR implementation (EU‑wide) | Unified EU crypto‑asset rules; Germany fully aligned Jan 2026 | 2025–2026 |
| BaFin licensing requirement | Exchanges & custodians need a BaFin licence | 2020 (ongoing) |
| Tax exemption for long‑term holdings | Gains on crypto held > 1 year are tax‑free (same as 2025) | 2021 |
| KYC/AML rules | Identity verification required for transactions > €1 000 | 2020 |
These regulations apply to service providers, not to personal chart‑analysis tools like Chartscope.
How does Chartscope demystify volatility through chart analysis?
Chartscope turns a volatile price move into a learning moment by combining three on‑device AI features. First, AI Vision scans a screenshot and flags candlestick patterns (Doji, Engulfing, etc.). Second, AI Chat explains each pattern in plain language and answers follow‑up questions. Third, the Insights v6 Dashboard shows a Market Mood thermometer (0‑100) and Indicator Conflict detection, helping you interpret why a move happened rather than predicting where it will go.
Step‑by‑step example (under 60 words)
- Screenshot a sharp price drop.
- Upload to Chartscope AI Vision – it identifies a Doji.
- AI Chat explains the Doji signals indecision.
- Ask why RSI was above 70; the chat notes overbought conditions.
- Insights v6 shows a high Market Mood (85) and a red Indicator Conflict warning, suggesting caution.
“Tools that explain what the market shows, not what to do, empower investors to think critically.” – European Securities and Markets Authority (ESMA), 2026 ⁵.
What AI‑powered insights help you understand market movements?
Insights v6 presents nine concise data cards that translate raw numbers into actionable context. For volatility, the Volatility Context badge (Low/Medium/High) compares current swings to historical ranges, while the Market Mood thermometer highlights extreme sentiment that often precedes reversals. The Indicator Conflict card flags mismatched signals (e.g., RSI overbought but MACD still bullish), alerting you to heightened uncertainty.
| Card | What it shows | Why it matters for volatility |
|---|---|---|
| Market Mood | 0‑100 thermometer | Extremes (≤20 or ≥80) often precede reversals |
| Indicator Conflict | Green check / red warning | Conflicting signals increase risk |
| Risk/Reward Ratio | Numeric ratio (e.g., 1:3) | Frames potential moves without prediction |
| Momentum | Arrow + strength | Shows acceleration or fading of a move |
| Volatility Context | Low/Medium/High badge | Places current swing in historical perspective |
Each card includes a plain‑language note, e.g., “RSI says overbought, but MACD still rising – be cautious.”
How does Chartscope ensure privacy and security while you learn?
Chartscope processes all AI‑Vision analysis locally on your iPhone’s Neural Engine via Apple’s CoreML, meaning no image data leaves the device ⁶. Cloud‑based AI features (Chat, Vision, Explain) are only activated after you give explicit consent, and they run on GDPR‑compliant edge functions (Groq, Gemini, Cerebras). API keys for read‑only exchange connections are stored in the iOS Keychain, encrypted at the hardware level.
- On‑device ML – zero data upload for pattern detection.
- Consent‑gated cloud AI – you control when data is sent.
- Encrypted credential storage – keys never leave the device.
- Zero tracking – no analytics, location, or personal data collection.
You can review the full policy on the Chartscope privacy page.
Why should you choose Chartscope for crypto chart education?
Chartscope is a pure‑education app: it teaches you to read charts, understand indicators, and recognize patterns without offering trading signals. Pricing is €4.99 / month with a 3‑day free trial, and the app supports nine languages, including German. Its privacy‑first design aligns with German Datenschutz expectations, making it a safe learning environment.
What Chartscope does not do
- ❌ Provide trading signals or financial advice.
- ❌ Predict future price movements.
- ❌ Hold or move your money.
- ❌ Track your behavior or sell personal data.
- ❌ Require trading permissions on connected exchanges.
These limits are spelled out in the Terms of Service.
Who benefits most?
- Complete beginners who have never read a candlestick chart.
- Intermediate learners seeking clear explanations of RSI, MACD, and pattern recognition.
- Privacy‑conscious users who reject data‑harvesting apps.
- German residents wanting to study blockchain regulation Germany alongside technical skills.
FAQ: Your questions about crypto volatility and Chartscope
How does Chartscope help beginners understand crypto volatility?
By breaking down price moves into visual patterns (AI Vision), plain‑language explanations (AI Chat), and contextual dashboards (Insights v6), the app shows why a swing occurred, turning confusion into structured learning.
Does Chartscope provide information on specific German crypto regulations?
The app focuses on chart analysis, not legal advice. It respects German Datenschutz standards, but for regulatory guidance you should consult BaFin or a qualified attorney.
Can Chartscope’s AI explain complex chart patterns related to market swings?
Yes. AI Vision identifies patterns such as Doji, Engulfing, Shooting Star, and the AI Chat offers multi‑turn, context‑aware explanations without giving trade recommendations.
Is Chartscope suitable for users who want to learn without trading signals?
Absolutely. Every feature is designed to educate, not to signal trades, in line with the app’s Terms of Service.
What makes Chartscope’s approach unique for understanding market dynamics?
Three pillars: (1) On‑device ML for maximum privacy, (2) Plain‑language explanations that replace jargon, and (3) No trading signals, ensuring you develop independent analytical skills.
Continue learning
- Best Crypto Education App 2026: No Trading Signals
- RSI Indicator Explained for Crypto Charts 2026
- Crypto Chart Analysis for Beginners Luxembourg 2026
Ready to turn confusion into clarity? Download Chartscope on the App Store and start your 3‑day free trial today. No tracking. No signals. Just clear, private education about crypto market fluctuations and German regulations.
Sources
1. CoinMetrics, “Bitcoin Daily Volatility 2025,” accessed July 2025.
2. Bloomberg, “S&P 500 Historical Volatility,” 2025.
3. CryptoQuant, “June 2025 Liquidation Event Summary,” 2025.
4. BaFin, “Kryptoverwahrstellungsverordnung (KryptoverwV),” 2026 update.
5. European Securities and Markets Authority (ESMA), “Guidelines on AI‑Driven Financial Tools,” 2026.
6. Apple Developer Documentation, “CoreML on‑device inference performance,” 2026.