Best Free App to Learn Crypto Chart Patterns & Indicators 2026

Is there a good free app to learn about crypto chart patterns and indicators? That’s the question every beginner asks after staring at a candlestick chart and feeling completely lost. You’ve seen the screenshots, heard the jargon — RSI, MACD, Doji, Engulfing — and you know these patterns matter. But where do you actually learn them without paying hundreds for a course or drowning in conflicting YouTube tutorials? This guide answers that question directly and shows you a practical path forward.
Why Chart Patterns Are Essential for Crypto Traders
The Real Cost of Not Understanding Charts
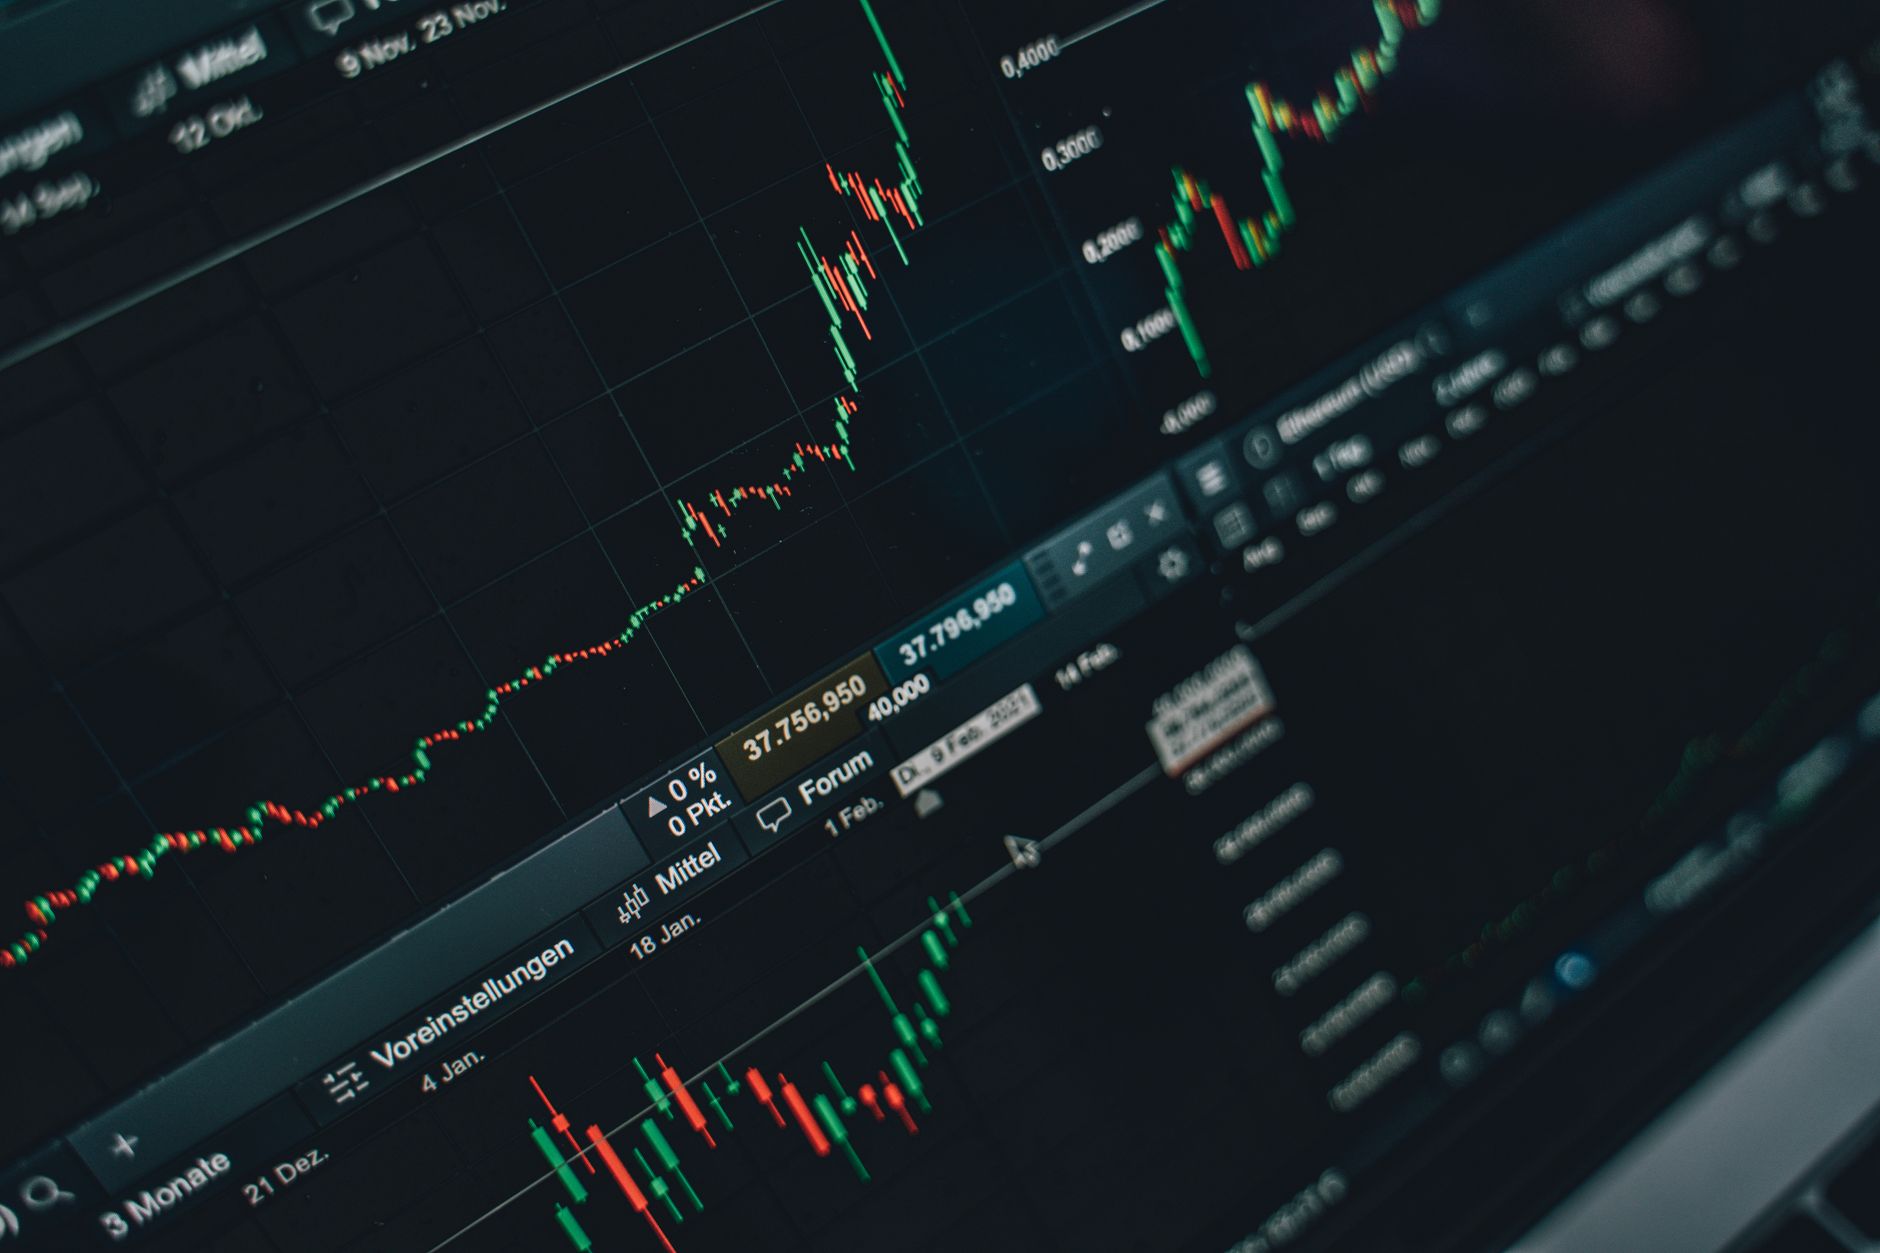
Crypto markets move fast. A single candlestick pattern can signal a reversal that happens in minutes, not days. For a beginner, the cost of ignorance isn’t just confusion — it’s real money lost on trades entered without understanding what the chart is telling you. Many new traders report losing their first deposits not because their strategy was wrong, but because they couldn’t read the basic signals.
Technical analysis isn’t about predicting the future. It’s about improving your odds. When you recognize a bullish engulfing pattern or a head and shoulders formation, you’re not guessing — you’re identifying a scenario that has historically played out in a certain way. That’s the edge.
The Language of Candlesticks
Every chart tells a story. Each candlestick represents a battle between buyers and sellers:
- Doji — Indecision. Buyers and sellers are evenly matched
- Hammer — Potential reversal after a downtrend
- Engulfing — Strong momentum shift in one direction
Learning these patterns is like learning a language. Once you can read it, the market stops being noise and starts being information. ChartScope’s AI Vision feature uses a vision LLM to read your chart screenshot and identify candlestick patterns like Doji, Engulfing, and Shooting Star — confirming what you see with your own eyes.
| Indicator | What It Measures | Why Beginners Should Learn It |
|---|---|---|
| RSI (Relative Strength Index) | Momentum on a 0–100 scale | Identifies overbought/oversold conditions |
| MACD (Moving Average Convergence Divergence) | Trend direction and momentum | Shows trend changes and strength |
| Candlestick Patterns | Price action in specific formations | Reveals potential reversals or continuations |
| Support/Resistance | Price levels where reversals occur | Helps set entry and exit points |
How to Identify Key Indicators Without Complexity
Start With Just Two Indicators
Here’s the mistake most beginners make: they try to learn every indicator at once. Stochastic, Bollinger Bands, Ichimoku, Fibonacci — the list never ends. The result is paralysis by analysis.
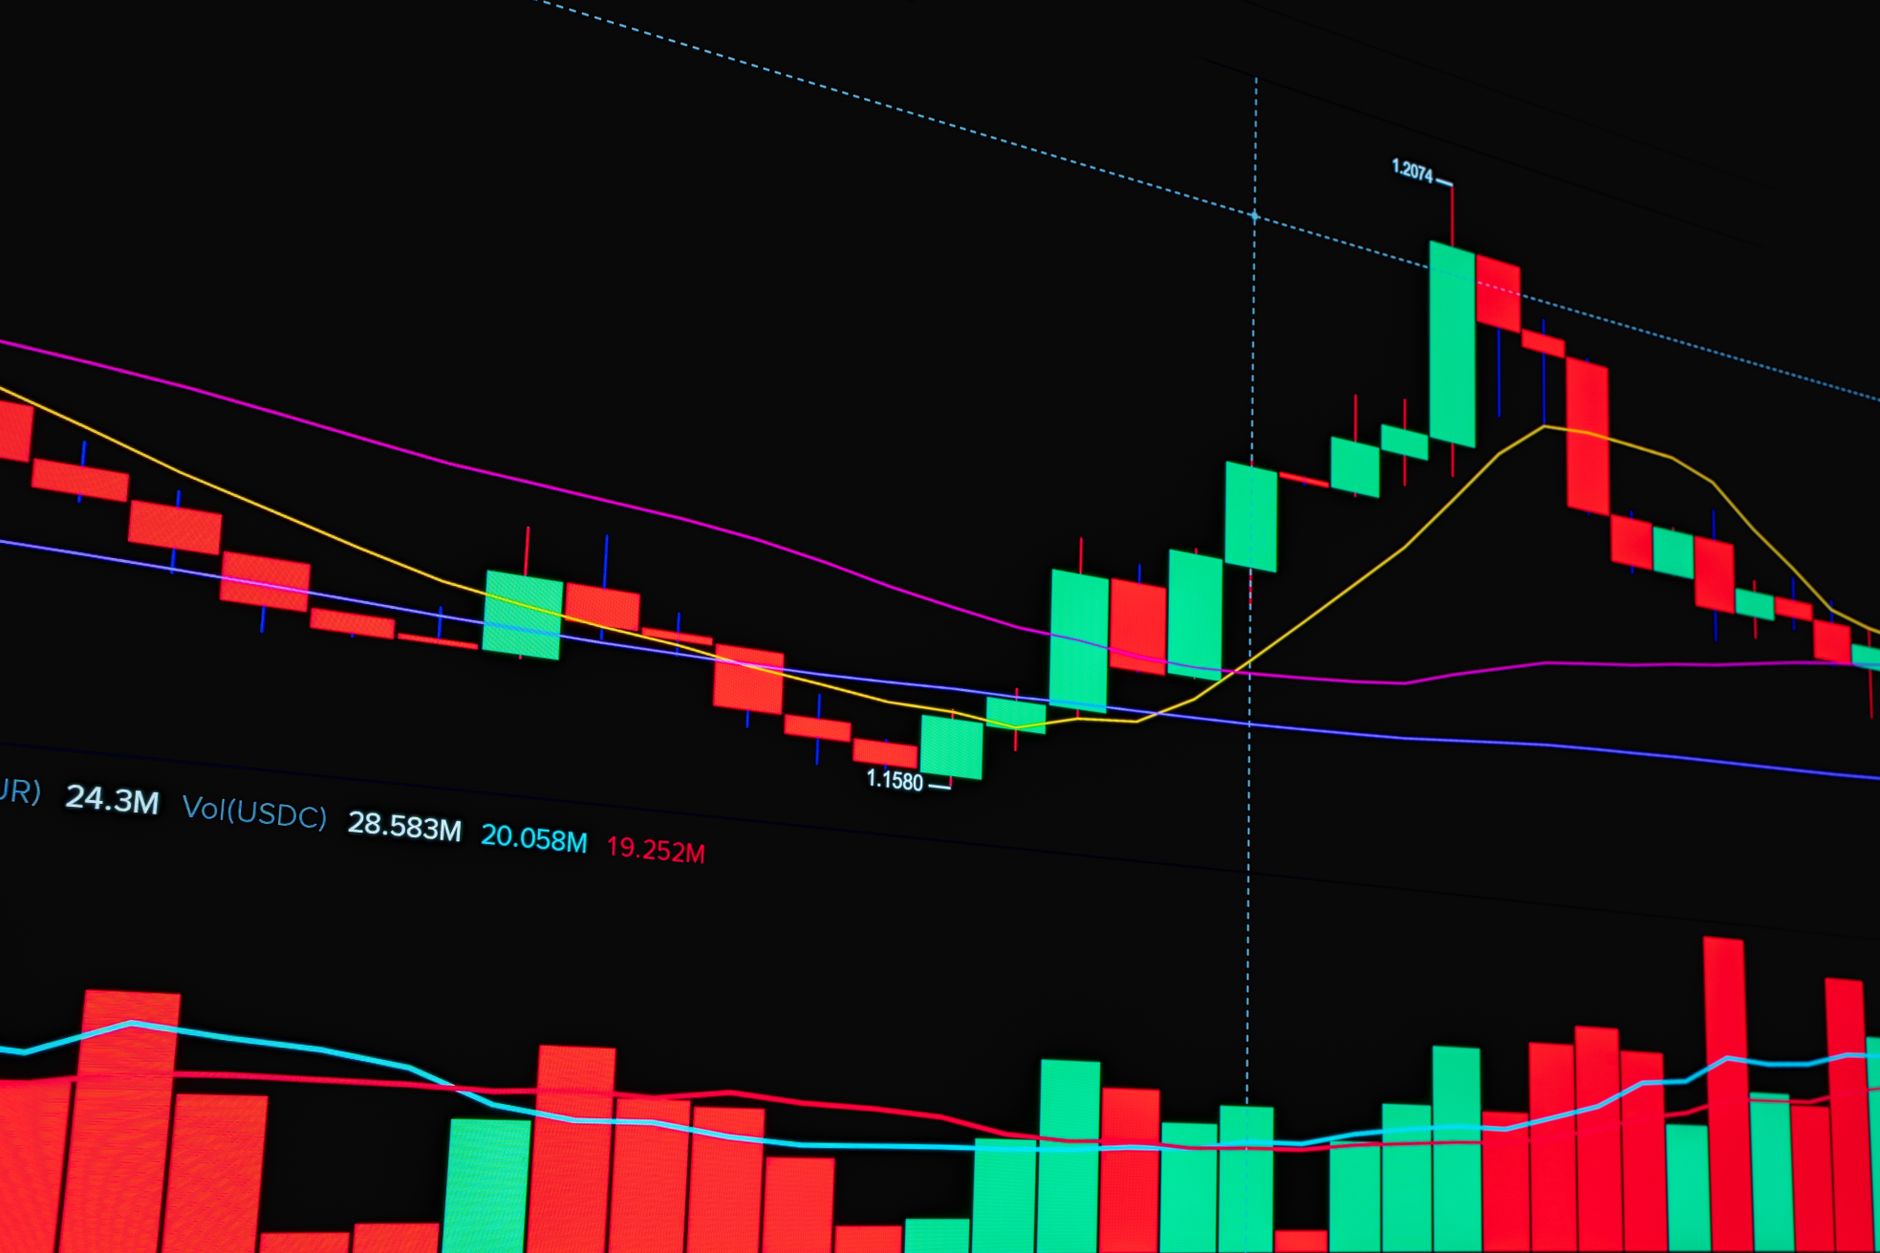
Start with RSI and MACD. These two indicators give you roughly 80% of the information you need for basic trend analysis. The RSI measures the speed and change of price movements on a scale of 0 to 100. When it’s above 70, the asset may be overbought. Below 30, it may be oversold.
MACD shows you the relationship between two moving averages. When the MACD line crosses above the signal line, it’s a bullish signal. Below — bearish. That’s the whole concept.
The 3-Step Indicator Checklist
Follow this exact process every time you open a chart:
- Check the trend first — Look at the overall direction. Is the chart making higher highs and higher lows (uptrend) or lower highs and lower lows (downtrend)?
- Apply RSI — Is the reading above 70 or below 30? If yes, the move may be exhausted.
- Confirm with MACD — Has the MACD line recently crossed the signal line? This confirms momentum direction.
This three-step process takes less than 60 seconds and gives you a solid foundation for any trading decision. The key is consistency — do it every time, not just when you remember.
Leveraging ChartScope for Real-Time Learning

AI That Explains, Not Just Displays
ChartScope is an AI crypto tutor designed specifically for beginners. Instead of throwing 50 indicators at you and hoping you figure it out, it explains what RSI, MACD, and candlestick patterns actually mean — in plain language, on your chart, in your language. The app supports 9 languages, making it accessible to a global audience.
The core philosophy is education, not signals. As the ChartScope homepage states: “No signals. No hype. Just clear, educational answers about what your chart is actually doing.” That’s a critical distinction. Many tools tell you what to buy or sell. ChartScope teaches you why a pattern matters so you can make your own informed decisions.
Three Features That Accelerate Learning
💬 AI Chat — Ask anything about your chart and get answers in plain language. The multi-turn conversational AI is context-aware, meaning it knows your current coin and timeframe. It never gives signals — it always explains why. This is how real learning happens: through questions and answers, not passive reading.
👁️ AI Vision — Take a screenshot of your chart and the vision LLM analyzes it visually. It identifies candlestick patterns, trends, and formations, then confirms or enriches the text analysis. This feature is perfect for checking your own analysis — did you spot the Doji correctly? The app confirms it.
📊 Insights v6 — Nine structured cards give you a complete picture: volatility, conflicts, risk/reward, momentum, and a Market Mood thermometer (0–100). The indicator conflict detection is particularly valuable — it tells you when different indicators are sending mixed signals, which is exactly when beginners get confused.
Privacy as a Learning Advantage
Here’s something most free crypto education tools don’t offer: complete privacy. According to the ChartScope privacy policy, all AI analysis happens on-device using Apple’s Core ML framework. Your market data is never sent to external AI servers. Zero tracking, zero data collection, zero analytics.
Why does this matter for learning? Because you can explore freely. You can test hypotheses, ask “dumb” questions, and analyze charts without worrying about your data being sold or your activity being tracked. The AI processing runs on your iPhone’s Neural Engine with ~1ms inference — it’s fast, private, and always available.
Building a Consistent Trading Routine in 2026

The 15-Minute Daily Practice
Learning technical analysis isn’t a one-time event — it’s a daily habit. The traders who succeed are the ones who practice consistently, not the ones who binge-learn for a weekend and then forget everything.
Here’s a realistic daily routine for 2026:
Morning (5 minutes): Open your charting app and identify the trend on your top 3 coins. Write down one sentence describing each trend.
Midday (5 minutes): Apply RSI and MACD to one chart. Note whether they agree or conflict. If they conflict, that’s valuable information — it means the market is indecisive.
Evening (5 minutes): Take a screenshot of one interesting chart and run it through ChartScope’s AI Vision. Did the app identify patterns you missed? Study the difference.
This routine takes 15 minutes total. In 30 days, you’ll have analyzed 90 different chart scenarios. That’s real experience — the kind that builds intuition.
Tracking Your Progress
Many users who track their learning progress report catching pattern recognition errors 2–3 weeks earlier than those who don’t. Keep a simple journal:
- What pattern did you identify?
- What did the indicators say?
- What happened afterward?
After 20–30 logged observations, you’ll start to see your own accuracy rate. That’s data you can actually learn from.
Common Pitfalls When Learning Technical Analysis
Pitfall #1: Indicator Overload
The most common mistake is trying to use too many indicators at once. Each indicator adds noise, not clarity. The fix: Limit yourself to RSI and MACD for your first 90 days. Master those before adding anything else.
Pitfall #2: Ignoring the Timeframe
A pattern on a 5-minute chart is noise. The same pattern on a daily chart is significant. Beginners often jump between timeframes without understanding this distinction. The fix: Pick one timeframe (daily is ideal for learning) and stick with it for at least two weeks.
Pitfall #3: Confusing Education with Signals
This is where most “free education” tools fail. They give you signals — buy this, sell that — without teaching you why. When you don’t understand the reasoning, you can’t adapt when conditions change. The fix: Use tools that explain, not just signal. ChartScope’s AI Chat explicitly never gives signals — it always explains why. That’s the educational approach.
Pitfall #4: Skipping the “Why”
“RSI is above 70, so sell” is not understanding. “RSI is above 70 because buying momentum has been strong but may be exhausting itself” is understanding. The fix: After every analysis, write one sentence explaining why the indicator is in its current state. If you can’t, you haven’t learned it yet.
FAQ
Is ChartScope a good app for learning crypto indicators?
Yes, for beginners specifically. ChartScope is designed as an educational tool that explains indicators in plain language rather than just displaying them. The AI Chat feature answers questions contextually, and the AI Vision feature analyzes your chart screenshots to confirm patterns. It uses on-device AI with zero tracking, making it a privacy-focused learning environment. The app costs €4.99/month with a 3-day free trial, which is significantly less than most crypto courses.
Can I learn chart patterns for free?
Yes, absolutely. The fundamental knowledge — candlestick patterns, RSI, MACD — is freely available through resources like Wikipedia and Investopedia. ChartScope offers a 3-day free trial that lets you explore its AI-powered explanations. Many users find that combining free educational content with a structured app accelerates learning significantly because you get immediate feedback on your analysis.
What are the most important indicators for beginners?
RSI and MACD are the two most important indicators for beginners. RSI (Relative Strength Index) measures momentum on a 0–100 scale and helps identify overbought or oversold conditions. MACD (Moving Average Convergence Divergence) shows trend direction and momentum through moving average relationships. Together, they cover trend, momentum, and potential reversal points — enough for a solid foundation. Candlestick patterns like Doji and Engulfing are also essential for reading price action.
How much time does it take to learn crypto technical analysis?
Most beginners can grasp the fundamentals of RSI, MACD, and basic candlestick patterns within 2–4 weeks of consistent daily practice. However, developing genuine intuition — the ability to read a chart quickly and accurately — typically takes 3–6 months of regular analysis. The key is consistency: 15 minutes daily beats 3 hours once a week.
Does ChartScope provide trading signals or financial advice?
No. ChartScope is explicitly designed for educational purposes only. According to its Terms of Service, the app does not provide financial advice, investment recommendations, or trading signals. All AI analysis represents pattern recognition, not financial advice. This is actually a benefit for learning — the app teaches you to think, not to blindly follow signals.
Continue Learning
Want to go deeper? Check out these related guides:
- Crypto Trading for Beginners: The Ultimate Data-Backed Step-by-Step Guide
- Free App to Learn RSI and MACD for Crypto Trading in 2026
- Top Crypto Education Platforms: A Data-Backed Comparison
This article is for informational and educational purposes only and does not constitute financial advice. Always consult with qualified financial advisors before making investment decisions.
Last updated: 2026-08-24