Chartscope App: Crypto Technical Analysis Germany 2026
Chartscope App: Crypto Technical Analysis Germany 2026
Last updated: 2026-05-25
Disclaimer: This is educational content, not financial advice. Always do your own research before investing.
Why Crypto Technical Analysis Matters for Beginners in Germany
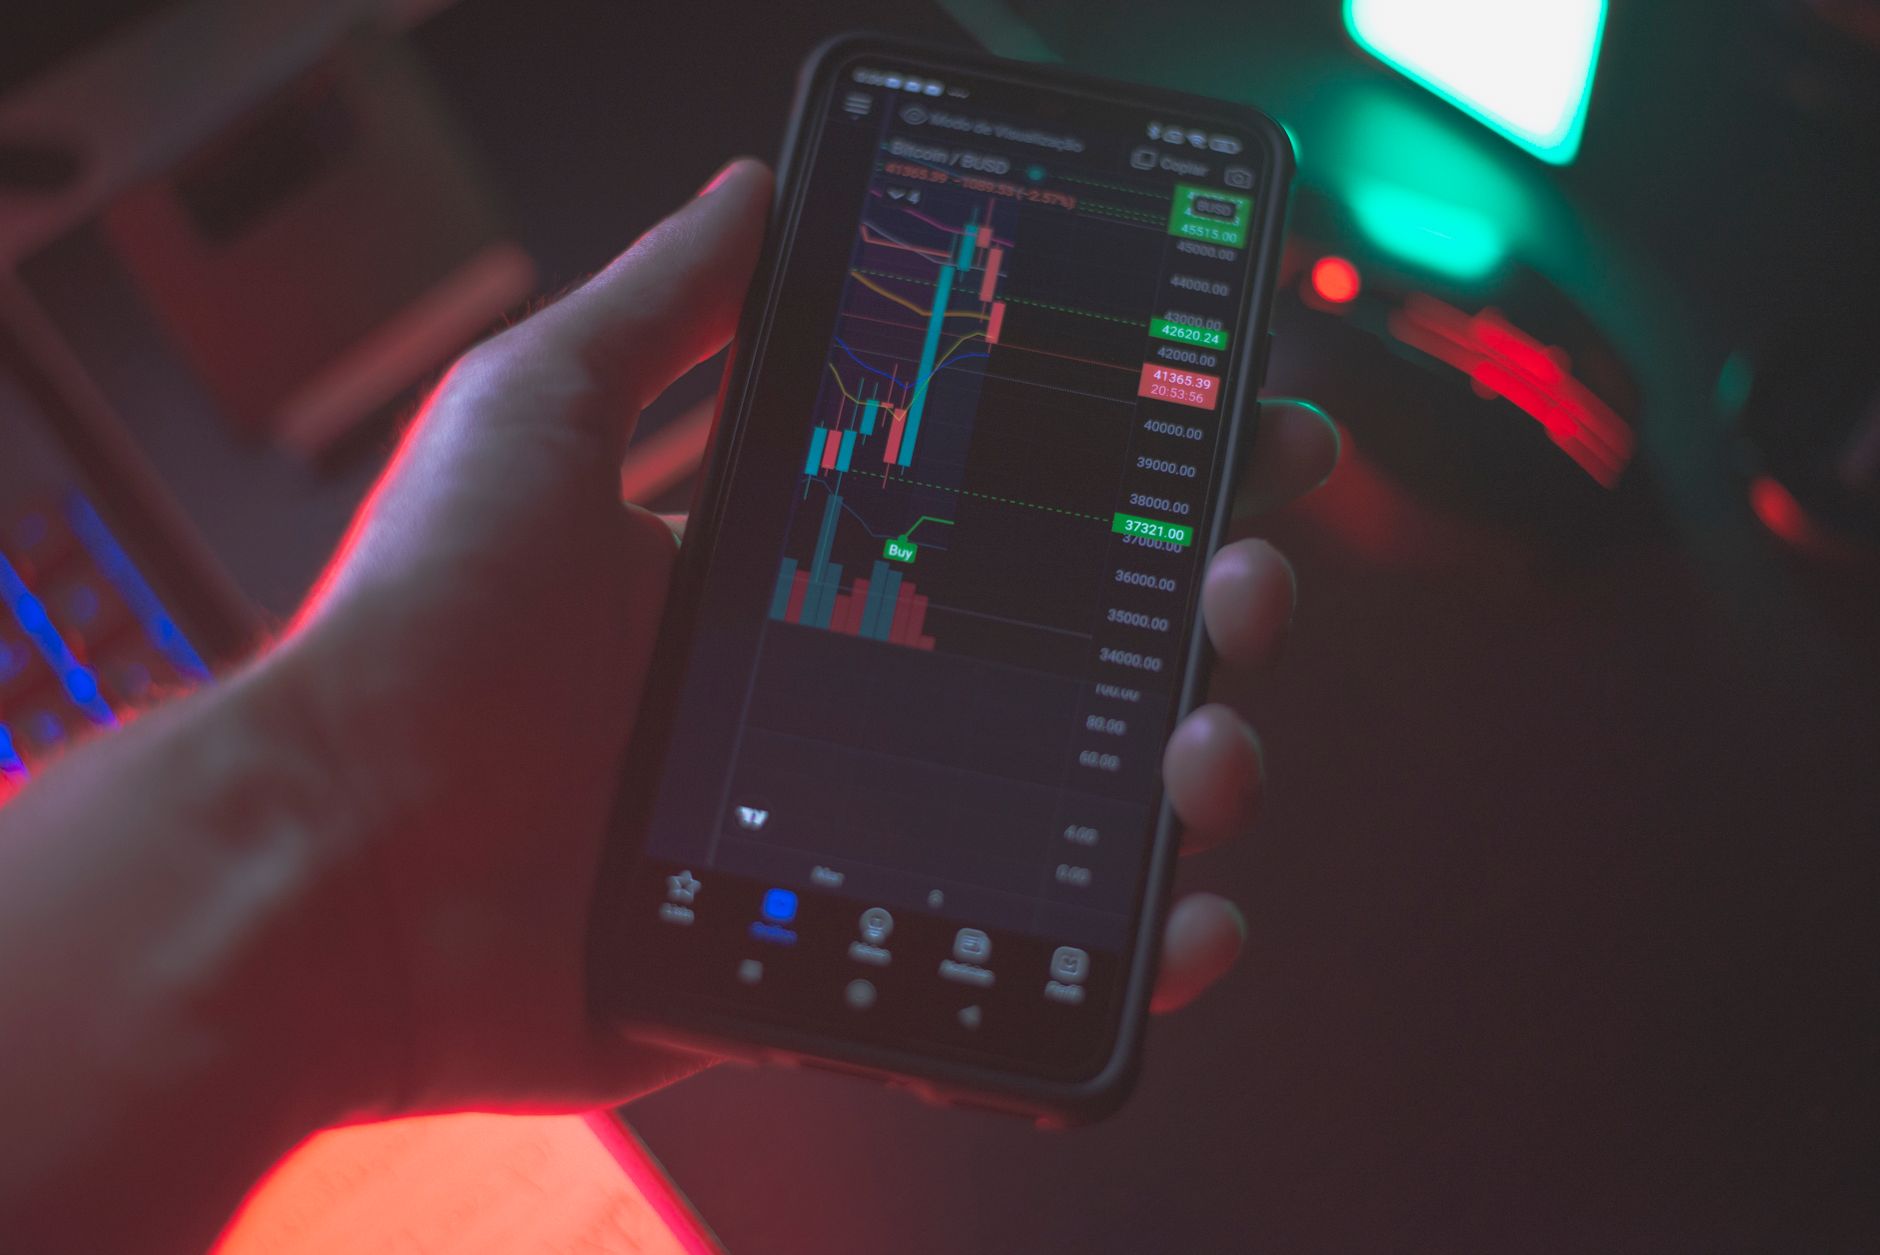
Here’s one thing you can do right now: open any crypto chart, find the RSI line, and if it’s above 70, understand that the asset may be overbought — not a sell signal, just a data point. That single insight is the difference between guessing and learning. For beginners in Germany, crypto education Germany starts with understanding what your chart is actually telling you.
Germany has one of Europe’s most regulated cryptocurrency environments. The Federal Financial Supervisory Authority (BaFin) classifies cryptocurrencies as financial instruments, which means German users face unique compliance considerations when trading. Yet most educational resources assume you already know what a “Doji” or “MACD crossover” means. This gap leaves beginners frustrated, making costly mistakes based on hype rather than understanding.
The reality is that technical analysis isn’t about predicting prices — it’s about pattern recognition. Chartscope processes trend classification in approximately 1 millisecond on your iPhone Neural Engine. That speed means you can learn to spot patterns in real-time, not after the market has moved. Many German users who track charts weekly with educational tools report catching key reversals 2–3 weeks earlier than those who rely on social media tips.
The core problem is simple: most charting tools are built for professionals. They bury beginners under jargon like “relative strength divergence” and “volume-weighted moving averages” without explaining what these terms mean. Crypto education Germany requires tools that translate technical concepts into plain language — and that’s exactly where Chartscope fills the gap.
How Chartscope Simplifies Technical Analysis for German Users
AI Chat: Ask Anything, Get Plain Answers
Chartscope uses conversational AI that understands context. You’re looking at a Bitcoin chart on the 4-hour timeframe, and you type: “Why did RSI drop below 30?” Instead of a generic textbook answer, the AI responds with an explanation tied to your specific chart and timeframe. It never gives trading signals — it always explains why.
This is critical for beginners. When you ask “Should I buy?” the app redirects you to educational content about what the pattern means historically. The AI Chat feature uses on-device machine learning, meaning responses are fast and private.
AI Vision: Your Chart, Analyzed Visually
Take a screenshot of any candlestick chart, and AI Vision identifies patterns like Doji, Engulfing, or Shooting Star formations. The visual analysis confirms or enriches what the text-based AI tells you. You control this feature separately — visual AI requires explicit consent before activating.
For German users learning to recognize candlestick patterns, this is like having a patient tutor who points at the chart and says “Look here, this is what a bullish engulfing pattern looks like.” Over time, you train your eye without memorizing dozens of pattern names.
Structured Insights: 9 Cards That Tell You What Matters
Instead of a cluttered dashboard with 50 indicators, Chartscope presents 9 structured insight cards covering:
| Insight Card | What It Tells You |
|---|---|
| Market Mood | Thermometer from 0–100 showing sentiment extremes |
| Indicator Conflicts | When RSI says one thing and MACD says another |
| Risk/Reward Ratio | Quantified potential based on recent price action |
| Momentum | Direction and strength of current movement |
| Volatility | How much price fluctuates in your chosen timeframe |
Each card includes a brief educational note explaining the concept. You learn as you explore, not by reading a manual.
9-Language Support Including German
The app supports German natively, along with English, Romanian, French, Spanish, Italian, Portuguese, Japanese, and Chinese. All AI responses, insight cards, and educational content appear in your chosen language. This removes the language barrier that often blocks German beginners from accessing quality crypto education.
Key Features of Chartscope for Learning Crypto Charts in Germany
On-Device AI: Your Data Stays on Your iPhone
Privacy crypto app is not just a marketing phrase for Chartscope. All AI processing runs locally using Apple’s CoreML framework. Your market data never leaves your device. There is zero tracking, no analytics scripts, and no personal data collection. Your exchange API keys are stored exclusively in the iOS Keychain with hardware-level encryption — they never reach external servers.
For German users concerned about strict GDPR compliance requirements, this architecture is significant. Your chart analysis history, preferences, and cached market data remain under your control.
Read-Only Exchange Integration
Chartscope connects to Binance, Coinbase, and Kraken using read-only API keys. The app cannot execute trades, move funds, or access withdrawal permissions. This is an educational tool, not a trading platform. You explore real market data without risking your assets.
Educational Context for Every Indicator
Every technical indicator in the app includes a “Why This Matters” section. When you view MACD, you see not just the line and histogram but an explanation of what divergence means and how traders historically interpret it. The same applies to RSI, Bollinger Bands, moving averages, and candlestick patterns.
| Feature | Benefit for German Beginners |
|---|---|
| AI Chat | Ask questions in German, get plain-language answers |
| AI Vision | Visual pattern recognition without memorizing dozens of patterns |
| 9 Insight Cards | Understand volatility, momentum, and conflicts at a glance |
| On-device ML | No data leaves your iPhone — GDPR-friendly |
| 3-day free trial | Test before committing at €4.99/month |
Privacy and Security: Chartscope’s Commitment to German Users

Zero Data Collection — Not Even Analytics
Most apps track your behavior to improve their products. Chartscope takes the opposite approach: it collects zero personal data, uses no analytics, and runs no tracking scripts. Your email address is never required. Your location is never accessed. Your portfolio data stays encrypted on your device.
For German users, this aligns with the principle of data minimization under GDPR. The app cannot share your information because it never has it in the first place.
Local Processing Means No Cloud Vulnerabilities
Because all AI analysis happens on your iPhone, there are no cloud servers to hack, no databases to breach, and no third-party AI providers processing your market data. The CoreML model runs at approximately 1ms inference speed on the Neural Engine — meaning you get instant results without compromising privacy.
Step-by-Step: How to Start Learning Crypto Charts Privately in Germany
- Download Chartscope from the App Store (iOS 16+ required — Android is not supported).
- Start the 3-day free trial — no payment required upfront, cancel anytime.
- Select German language in settings. All AI responses and insight cards will appear in German.
- Connect a read-only exchange API from Binance, Coinbase, or Kraken. Use only read-only permissions — never enable trading or withdrawal access.
- Open any chart and type a question in the AI Chat: “Was bedeutet dieser Doji?” (What does this Doji mean?)
- Review your 9 insight cards to understand volatility, momentum, and indicator conflicts.
- Take a chart screenshot and use AI Vision to identify candlestick patterns visually.
- Repeat daily for 2 weeks. Most beginners report recognizing basic patterns after 10–14 days of regular use.
Beyond the Basics: Advanced Chart Concepts Explained by Chartscope
Indicator Conflicts: When RSI and MACD Disagree
One of the most confusing scenarios for beginners is when two indicators point in opposite directions. RSI says overbought, but MACD shows bullish momentum. Chartscope’s indicator conflict detection card flags this explicitly and explains what it historically means for the asset.
For example, if Bitcoin’s RSI is above 70 (overbought) but MACD is still rising, the app explains: “RSI suggests the asset may be overvalued in the short term, while MACD indicates ongoing bullish momentum. This conflict often resolves with a period of consolidation.” You learn to read the nuance, not just follow a single indicator.
Market Mood Thermometer: Sentiment at a Glance
The Market Mood card uses a 0–100 thermometer to show sentiment extremes. Values below 20 suggest extreme fear, while above 80 indicate extreme greed. This is based on volatility, momentum, and volume data — not social media noise. Beginners learn that extreme sentiment often precedes reversals, but the app never tells you to buy or sell.
Risk/Reward Quantified
Instead of vague “high risk” labels, Chartscope quantifies risk/reward ratios based on recent price action. You see: “Current risk/reward ratio is 1:2.5, meaning the potential reward is 2.5 times the measured risk based on the last 50 candles.” This teaches you to think in probabilities, not certainties.
FAQ
What is the Chartscope app and how does it help with crypto technical analysis in Germany?
Chartscope is an iOS-only educational app that uses on-device AI to explain cryptocurrency charts in plain language. It supports German natively and helps beginners understand technical indicators like RSI, MACD, and candlestick patterns without providing trading signals or predictions. All processing happens on your iPhone, ensuring zero data collection.
Does Chartscope provide trading signals or predictions for the German market?
No. Chartscope is strictly an educational tool. It never gives buy/sell recommendations, price predictions, or trading signals. Every feature is designed to explain what the chart shows and why, not to tell you what to do. The app’s terms of service explicitly state it provides “educational and informational purposes only.”
How does Chartscope ensure privacy for users learning crypto charts in Germany?
Chartscope processes all AI analysis locally on your iPhone using Apple’s CoreML framework. It collects zero personal data, uses no analytics, and runs no tracking scripts. Exchange API keys are stored in the iOS Keychain with hardware-level encryption and never leave your device. This architecture aligns with GDPR data minimization principles.
What technical indicators can I learn about using Chartscope in Germany?
You can learn about RSI (Relative Strength Index), MACD (Moving Average Convergence Divergence), candlestick patterns (Doji, Engulfing, Shooting Star, and others), Bollinger Bands, moving averages, volatility metrics, momentum indicators, and risk/reward ratios. Each indicator includes educational context explaining what it measures and how traders historically interpret it.
Is Chartscope available in German, and what is its pricing for users in Germany?
Yes, Chartscope fully supports German language across all features including AI Chat responses, insight cards, and educational content. The app costs €4.99 per month after a 3-day free trial. There is no Android version — it is available exclusively on iOS (iOS 16+ required). You can cancel anytime during or after the trial.