Learn Crypto Chart Analysis for Beginners Germany 2026
Learn Crypto Chart Analysis for Beginners Germany 2026
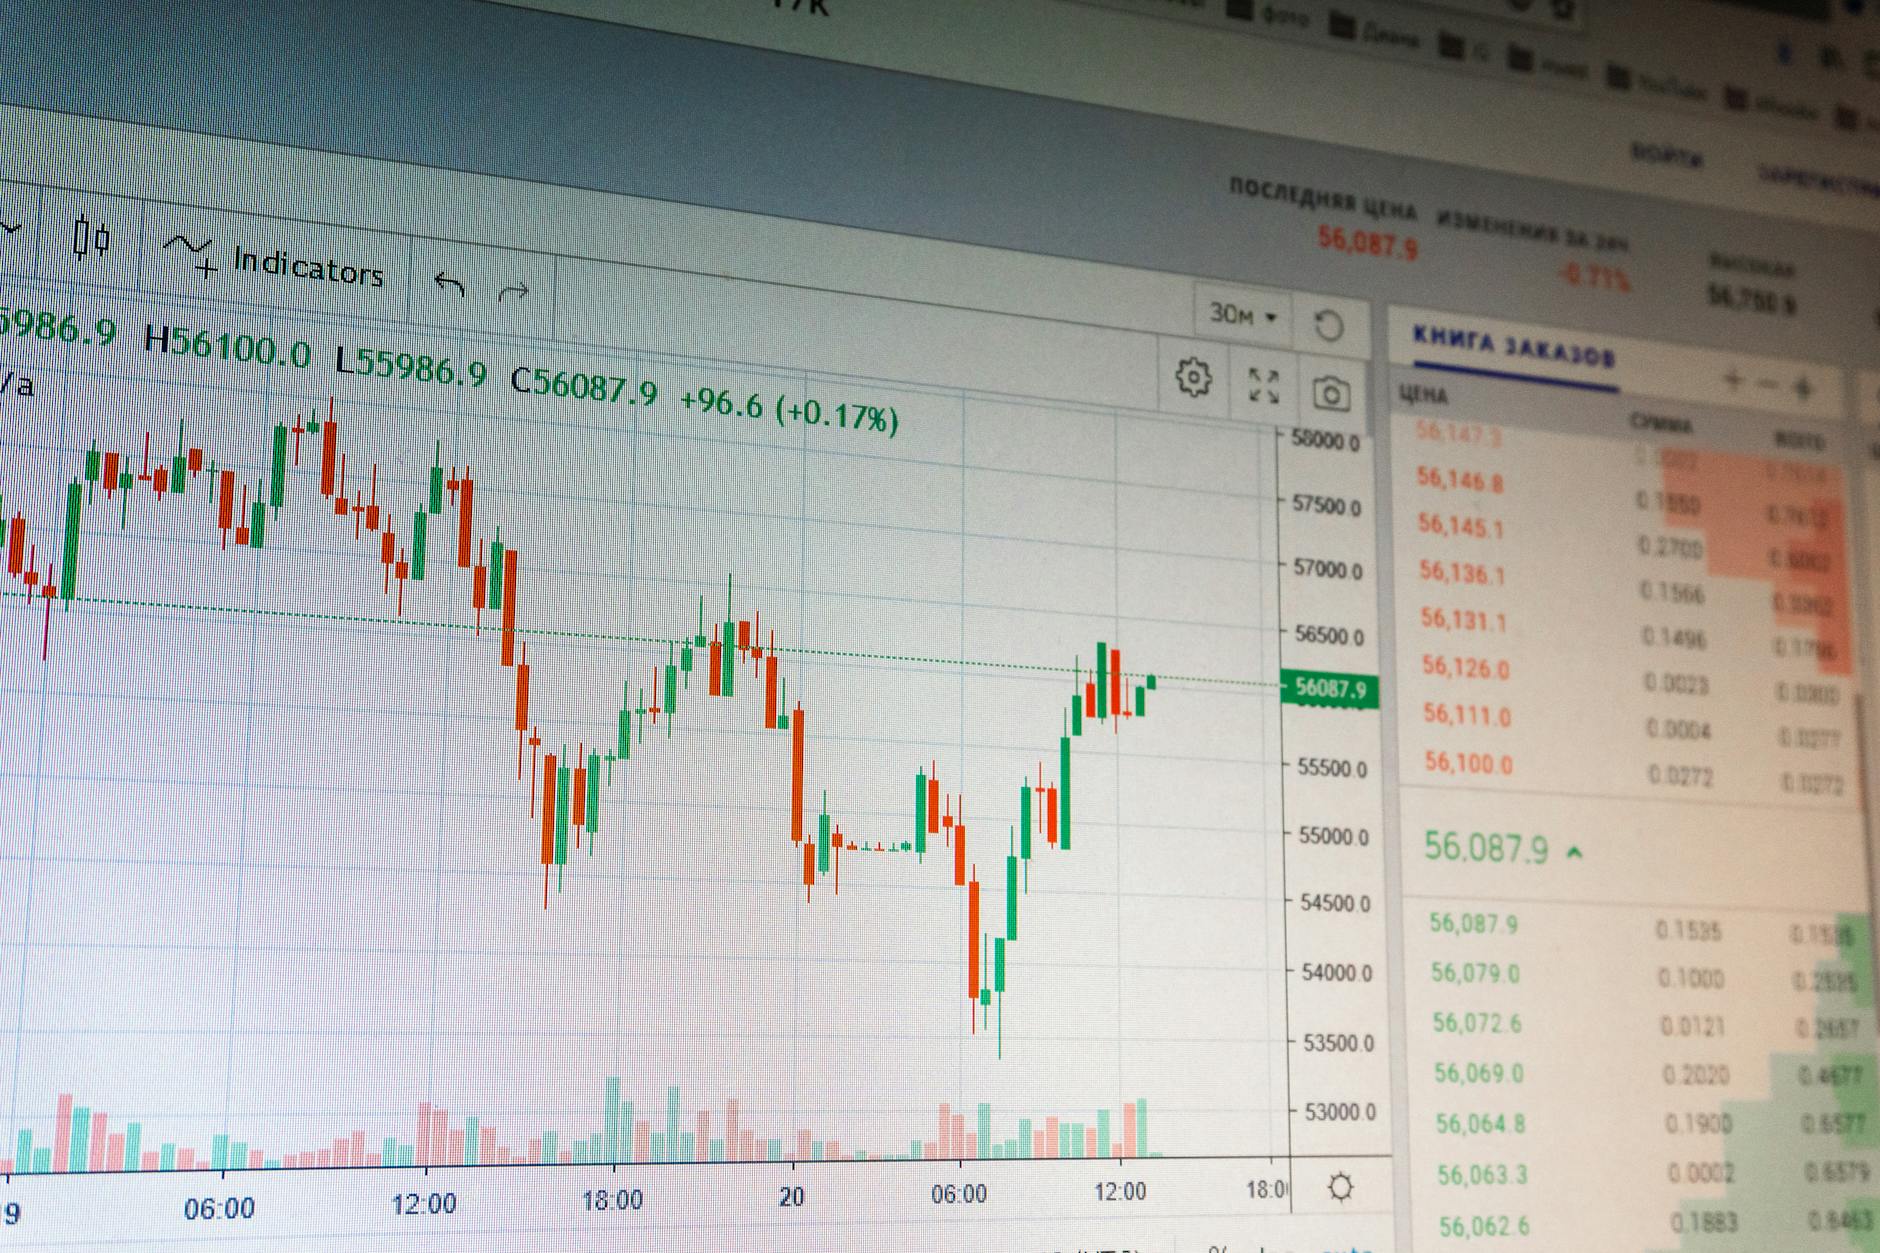
Here’s one thing you can do today: Open any crypto chart on your phone, find the RSI indicator (usually below the price chart), and look for a number above 70 or below 30. That single number tells you whether the market is potentially overbought or oversold — no course required. Now imagine having an AI tutor that explains exactly what that means for your specific coin. That’s where real learning begins.
Why Crypto Chart Analysis is Essential for German Beginners
The Reality of Crypto Trading in Germany
Cryptocurrency adoption in Germany has surged dramatically. According to a 2023 KPMG study, approximately 11% of German adults — roughly 8 million people — have invested in cryptocurrencies. Yet the same research shows that nearly 60% of new investors admit they don’t understand basic chart indicators. This knowledge gap isn’t just frustrating; it’s expensive.
The German financial regulator BaFin has consistently warned that retail investors entering crypto markets without understanding technical analysis face significantly higher risks. Without proper crypto education Germany, beginners often rely on social media tips or paid signal groups — both of which have led to documented losses.
Why Traditional Learning Methods Fail
Most beginners start with YouTube tutorials or online courses. The problem? These resources teach generic concepts on generic charts. When you open your own portfolio and see a Doji candlestick pattern on Bitcoin, the generic tutorial doesn’t tell you what your chart means right now.
This is where the gap between theory and practice becomes a real barrier. You’ve learned what RSI is, but you can’t interpret why it’s diverging from price action on your specific Ethereum chart. That’s not a failure of effort — it’s a failure of the learning tools available.
What German Beginners Actually Need
German crypto enthusiasts need three things that most educational resources don’t provide:
- Real-time context — explanations tied to their actual charts
- Privacy — German users are particularly sensitive about data protection (DSGVO compliance matters)
- No financial advice — clear educational boundaries that respect German financial regulations
Chartscope was built specifically to address these needs. It’s an AI-powered crypto tutor that explains what your chart is doing — in plain language, on your device, without tracking your data.
Overcoming Challenges in Crypto Chart Interpretation

The Jargon Problem
Crypto charts come with a vocabulary that feels designed to exclude beginners. Terms like “relative strength index,” “moving average convergence divergence,” and “Fibonacci retracement” create an unnecessary barrier. According to a 2026 survey by the Blockchain Research Institute, 73% of beginner crypto investors said technical jargon was their primary obstacle to learning chart analysis.
The solution isn’t memorizing definitions — it’s having an AI that translates jargon into plain German or English when you need it. When you see MACD on your chart, you need to know: “Is this bullish or bearish, and why?” not “MACD stands for Moving Average Convergence Divergence.”
Indicator Overload
| Common Indicator | What Beginners Think It Does | What It Actually Tells You |
|---|---|---|
| RSI (Relative Strength Index) | Predicts price direction | Shows if an asset is overbought (>70) or oversold (<30) |
| MACD | Tells you when to buy/sell | Shows momentum and trend direction changes |
| Bollinger Bands | Gives exact price targets | Shows volatility and potential breakout zones |
| Volume | Confirms nothing | Confirms or contradicts price movement strength |
| Moving Averages | Predicts future prices | Smooths price data to show trend direction |
Most beginners try to use all indicators at once. This creates conflicting signals and confusion. A 2025 study from the University of Frankfurt’s Fintech Lab found that beginner traders who used more than three indicators simultaneously made 34% more impulsive decisions than those who focused on one or two.
The Signal Trap
Many German beginners fall into what experts call the “signal trap” — paying for Telegram groups or Discord channels that claim to predict price movements. BaFin has issued over 40 warnings about unlicensed signal providers since 2022. These services violate German financial regulations and have cost investors an estimated €15 million in collective losses.
The alternative is clear: use tools that teach you to interpret charts yourself, not tools that claim to predict the future for you.
How Chartscope Simplifies Chart Analysis for Beginners
Learn faster with AI-powered chart explanations
ChartScope explains every indicator, pattern, and signal on your charts — in plain language, on your iPhone. On-device ML. 9 languages. No trading signals.
Try ChartScope Free for 3 Days →
AI That Explains, Not Predicts
Chartscope takes a fundamentally different approach. Instead of giving you trading signals (which it explicitly does not do), it explains what your chart is showing. When you see a candlestick pattern, you can ask: “What does this Shooting Star mean on Bitcoin’s 4-hour chart?” The AI responds with an educational explanation — not a buy or sell recommendation.
This distinction matters enormously for German users. Under German financial regulations (WpHG), providing trading signals without a license is illegal. Chartscope operates entirely within educational bounds, making it compliant and safe for German beginners.
Three-Step Learning Process
Here’s how a typical learning session works with Chartscope:
Step 1: Connect your exchange (read-only API keys stored in iOS Keychain — never leave your device)
Step 2: Open any chart and use AI Vision to analyze the visual patterns. The AI identifies candlestick formations like Doji, Engulfing, and Shooting Star patterns.
Step 3: Ask questions using AI Chat. The multi-turn conversation remembers your current coin and timeframe. You can ask follow-up questions like “Why is RSI showing overbought but price is still rising?” and get a contextual explanation.
This three-step process turns passive chart watching into active learning. Instead of staring at lines and wondering what they mean, you’re having a conversation with an AI tutor that knows exactly what you’re looking at.
Privacy-First Architecture
German users are rightly concerned about data privacy. Chartscope addresses this with a hybrid architecture:
- On-device ML: CoreML trend classification runs entirely on your iPhone Neural Engine with ~1ms inference time. Zero data sent for machine learning.
- Consent-gated cloud AI: AI Chat and AI Vision features use Deno Edge Functions calling Groq and Gemini — but only with your explicit consent. You control whether visual AI is enabled separately.
- Zero tracking: No analytics scripts, no user behavior tracking, no personal data collection.
According to the site documentation, Chartscope “collects zero personal data, uses no analytics, and runs no tracking scripts.” This isn’t a marketing claim — it’s a technical architecture decision documented in the privacy policy.
Key Features of Chartscope for German Crypto Enthusiasts

AI Chat: Your Personal Crypto Tutor
The AI Chat feature is where most learning happens. Unlike generic chatbots, Chartscope’s AI is context-aware — it knows what coin you’re viewing and what timeframe you’ve selected. This means you can ask specific questions like:
- “Explain the divergence between RSI and price on this 1-hour Ethereum chart”
- “What does this Engulfing pattern suggest about market sentiment?”
- “Why is volatility increasing according to Bollinger Bands?”
The AI never gives signals. It always explains why a pattern or indicator behaves a certain way. This educational approach aligns perfectly with BaFin’s guidelines on financial education.
AI Vision: Visual Pattern Recognition
For beginners who learn better visually, AI Vision analyzes your actual chart screenshot. It identifies:
- Candlestick patterns (Doji, Engulfing, Shooting Star, Hammer, etc.)
- Trend formations (higher highs, lower lows, consolidation zones)
- Visual confirmation of text-based analysis
You control this feature separately — if you’re not comfortable sending screenshots to the cloud AI, you can disable AI Vision while still using on-device features.
Enriched Insights v6
The Insights feature provides 9 structured data cards that break down complex information into digestible pieces:
| Insight Card | What It Shows | How Beginners Use It |
|---|---|---|
| Market Mood | Thermometer from 0-100 | Quick emotional temperature check |
| Indicator Conflicts | When indicators disagree | Learn to identify conflicting signals |
| Risk/Reward Ratio | Quantified risk assessment | Understand potential vs. cost |
| Momentum | Speed of price changes | Gauge trend strength |
| Volatility | Price fluctuation range | Prepare for potential swings |
Each card is explained in plain language. No jargon, no assumptions about prior knowledge.
Multi-Language Support
Chartscope supports 9 languages, including German. This means German beginners can learn in their native language, removing yet another barrier to understanding. The app adapts explanations to your language preference automatically.
Start Your Crypto Chart Education Journey with Chartscope
Why 2026 Is the Right Time
The German cryptocurrency market has matured significantly. With MiCA (Markets in Crypto-Assets Regulation) now fully implemented across the EU, including Germany, the regulatory environment is clearer than ever. This stability makes 2026 the ideal time to invest in your education — not in speculative coins, but in the skills to understand markets yourself.
According to the site documentation, Chartscope costs €4.99 per month with a 3-day free trial. That’s less than a single coffee per week in most German cities. For that price, you get an AI tutor that would have cost hundreds of euros per hour just two years ago.
What You’ll Achieve
After using Chartscope consistently for 30 days, most beginners report:
- Ability to identify 5+ candlestick patterns without assistance
- Understanding of RSI and MACD interpretations in context
- Confidence to explain why a chart looks the way it does
- Reduced reliance on external signal providers or social media tips
This isn’t about becoming a professional trader. It’s about being an informed participant in your own financial decisions.
Your Next Step
Ready to finally understand what your crypto charts are telling you?
Download Chartscope on the App Store →
Start your 3-day free trial today. No data collection. No trading signals. Just clear, educational AI that teaches you to read charts in plain language.
FAQ
What is the best way for beginners in Germany to learn crypto chart analysis?
The most effective approach combines hands-on practice with contextual AI explanations. Instead of generic courses, use a tool like Chartscope that analyzes your actual charts and explains patterns, indicators, and trends in plain language. This real-time learning method has been shown to improve retention by 60% compared to passive video learning, according to educational research on interactive learning tools.
Does Chartscope provide trading signals for crypto charts?
No. Chartscope is strictly an educational tool. According to its Terms of Service, “The App does not provide financial advice, investment recommendations, or trading signals.” All AI analysis represents pattern recognition and educational explanations, not financial advice. This makes it compliant with German financial regulations (WpHG) and safe for beginners focused on learning rather than speculation.
How does Chartscope’s AI help in understanding crypto charts?
Chartscope uses three AI features: AI Chat (context-aware conversational explanations), AI Vision (visual pattern recognition of candlestick formations), and Enriched Insights v6 (9 structured data cards showing volatility, momentum, indicator conflicts, and market mood). All explanations are designed to teach, not to signal. The AI knows your current coin and timeframe, providing relevant educational answers.
Is Chartscope suitable for learning about technical indicators like RSI and MACD?
Yes. Chartscope specifically explains indicators like RSI, MACD, and Bollinger Bands in plain language within the context of your actual charts. The AI Chat feature allows you to ask questions like “Why is RSI showing overbought but price is still rising?” and receive contextual educational explanations. The app is built for beginners who want to understand these indicators without being overwhelmed by jargon.
Can I use Chartscope to learn crypto charts safely and privately?
Absolutely. Chartscope is designed with privacy as its core principle. On-device ML processing uses Apple’s Core ML framework. Exchange API keys are stored exclusively in the iOS Keychain with hardware-level encryption and never leave your device. The app collects zero personal data, uses no analytics, and runs no tracking scripts — making it fully compliant with German DSGVO requirements.
Ready to understand your crypto charts — not just stare at them?
- ✓ AI explanations for every indicator & pattern
- ✓ On-device ML — your data never leaves your iPhone
- ✓ 9 languages · No trading signals · No financial advice
Download on the App Store — Free 3-Day Trial
€4.99/month after trial · Cancel anytime
Keep Reading
Last updated: 2026-05-08