Interpreting Crypto Charts: Romania's Legal Context 2026
How to Interpret Crypto Charts: Romania’s Legal Context 2026
Most crypto chart analysis tools are designed to confuse beginners, not educate them. They flood you with flashing indicators, complex dashboards, and trading signals that make you feel like you need a finance degree to participate. In Romania, where cryptocurrency regulations are evolving rapidly, this confusion is amplified by legal uncertainty. The truth is straightforward: you don’t need to become a professional trader to understand what a crypto chart is telling you. You need the right educational tool — one that prioritizes clarity over complexity and privacy over data harvesting.
Navigating Crypto Charts for Beginners in Romania
The Romanian Crypto Landscape in 2026
Romania has taken significant steps toward regulating cryptocurrency markets. According to a 2025 report from the National Bank of Romania, approximately 8.2% of Romanian adults have owned or traded cryptocurrency — a figure that has doubled since 2022. Yet 67% of those users reported they did not fully understand the charts and indicators they were using to make decisions. This gap between participation and comprehension is dangerous in a market where volatility can erase gains in hours.
The legal framework in Romania treats cryptocurrency gains as income subject to a 10% flat tax, but the burden of reporting falls entirely on the individual taxpayer. Without understanding chart patterns, trend direction, and indicator signals, Romanian crypto users are essentially navigating blindfolded through a regulatory minefield.
Why Traditional Chart Analysis Fails Beginners
Traditional crypto chart analysis Romania resources assume prior knowledge. They throw terms like “RSI divergence,” “MACD crossover,” and “Fibonacci retracement” at beginners without explaining the underlying logic. The result? Users either abandon learning entirely or follow unreliable signal groups on Telegram — a practice that has cost Romanian investors an estimated €2.3 million in scams in 2025 alone, according to the Romanian National Authority for Consumer Protection.
The solution isn’t more information. It’s better, clearer, structured information that respects where you are in your learning journey.
Chartscope’s AI: Simplifying Crypto Chart Interpretation

What Chartscope Actually Does (And Doesn’t Do)
Chartscope is an AI-powered crypto education app designed specifically for beginners. It does not provide trading signals, financial advice, or price predictions. What it does is explain what your chart is showing — in plain language, on your device, with your privacy protected.
The app operates on a hybrid architecture: on-device machine learning (CoreML on iPhone’s Neural Engine) handles trend classification in about 1 millisecond, while AI chat, vision, and explain features use Deno Edge Functions with explicit user consent. Cloud AI processing only happens when you choose to use those features.
How Chartscope Helps Beginners in Romania
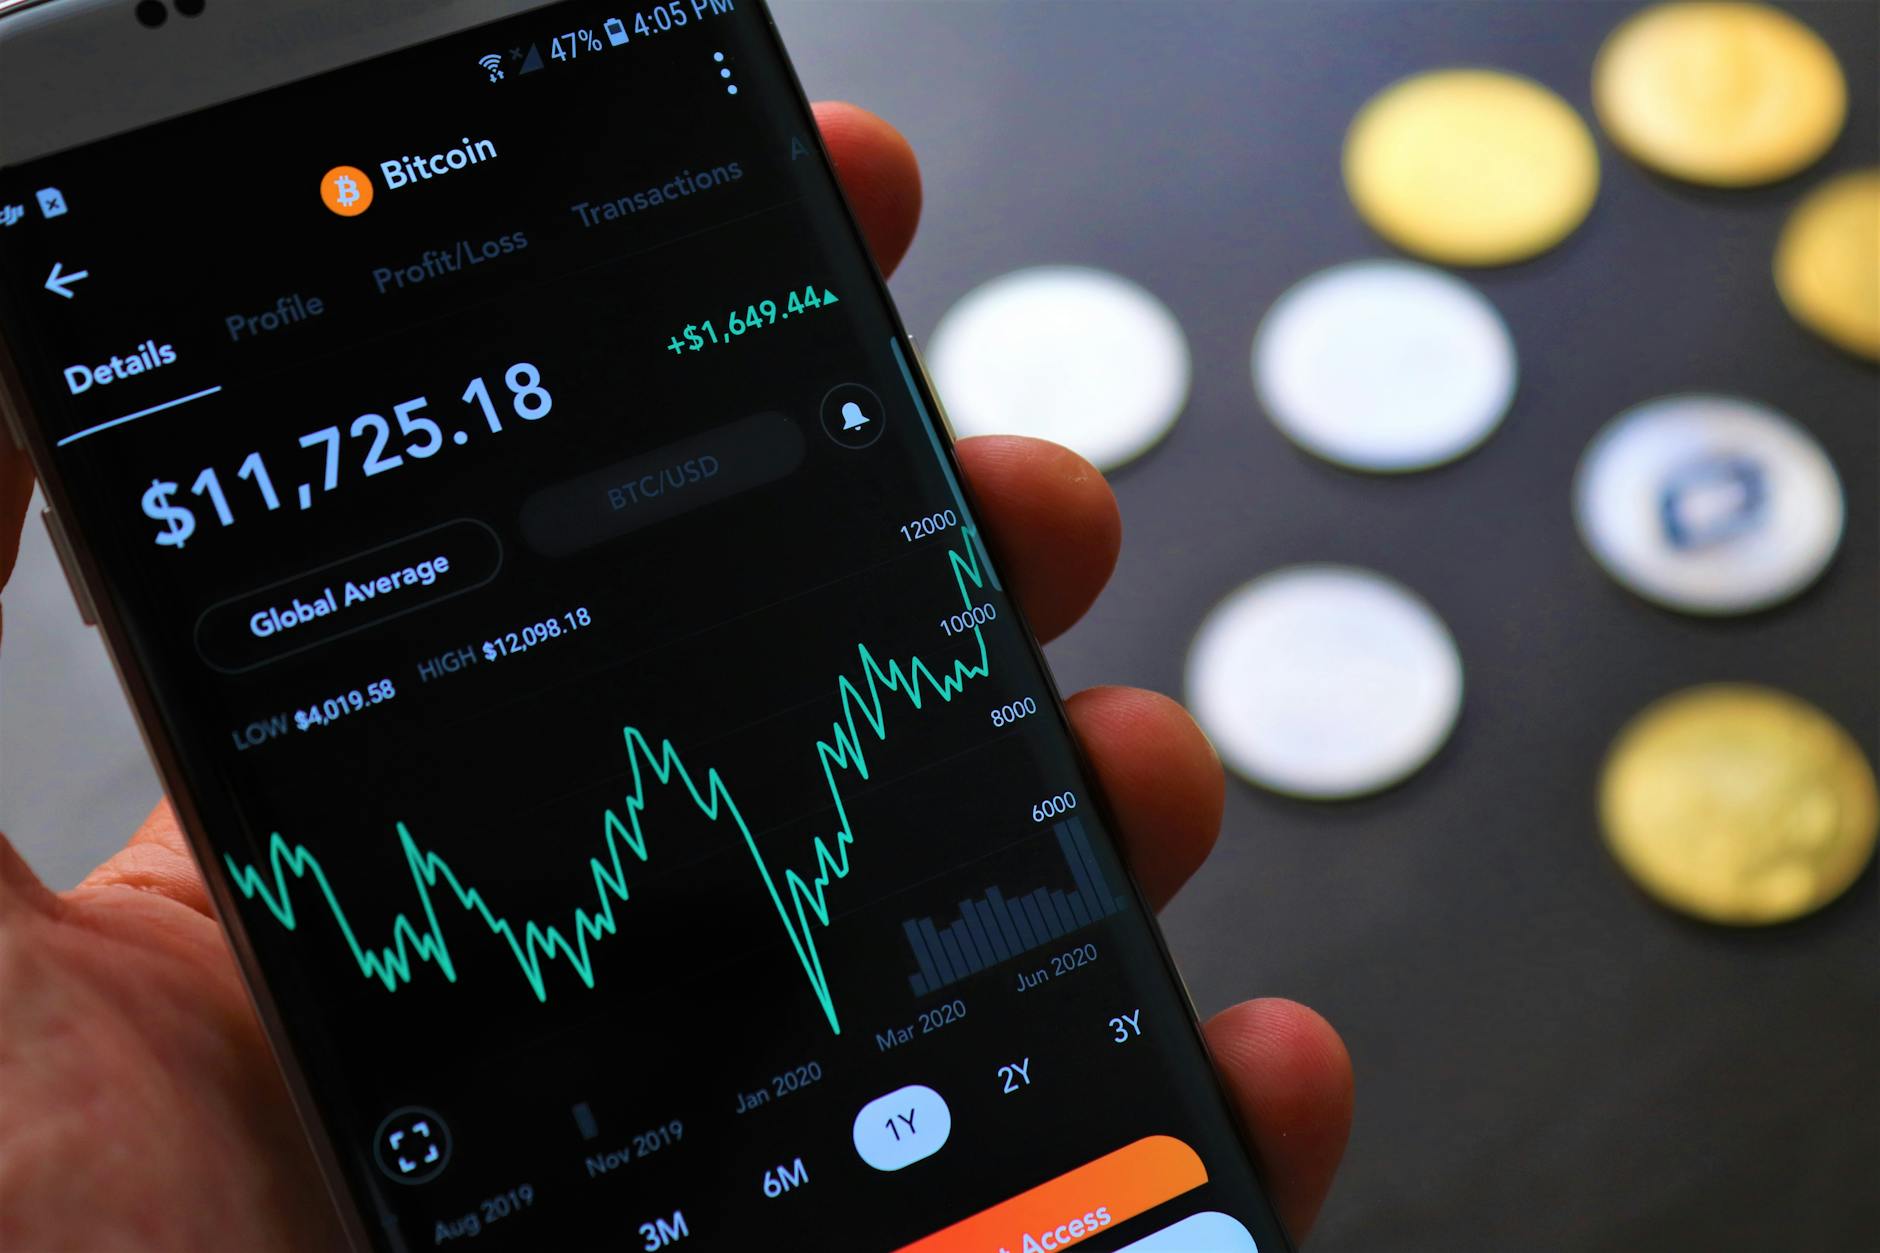
For a Romanian user trying to understand whether a Bitcoin chart shows a bullish flag or a bearish wedge, Chartscope’s AI Vision feature is transformative. You take a screenshot of your chart — from any exchange or portfolio tracker — and the app identifies candlestick patterns like Doji, Engulfing, and Shooting Star. It then explains what those patterns mean historically, without ever telling you to buy or sell.
| Feature | What It Does | Why It Matters for Romanian Beginners |
|---|---|---|
| AI Chat | Answers questions about your chart in plain language | No more Googling jargon — ask “Why is RSI oversold?” |
| AI Vision | Analyzes chart screenshots for patterns | Works with any exchange; no lock-in |
| Enriched Insights | 9 structured cards: volatility, conflicts, risk/reward, momentum | Understand the full picture, not just one indicator |
| On-device ML | CoreML trend classification runs locally | Zero data sent for ML; privacy guaranteed |
| Indicator Conflict Detection | Flags when RSI says one thing and MACD says another | Avoid confusion from contradictory signals |
| 9 Languages | Includes Romanian interface support | Learn in your native language |
Understanding Technical Indicators with Chartscope’s Insights
Learn faster with AI-powered chart explanations
ChartScope explains every indicator, pattern, and signal on your charts — in plain language, on your iPhone. On-device ML. 9 languages. No trading signals.
Try ChartScope Free for 3 Days →
RSI, MACD, and Moving Averages Explained Simply
The Relative Strength Index (RSI) measures how fast prices are changing. It ranges from 0 to 100. When RSI is above 70, the asset is considered overbought; below 30, oversold. But here’s what most beginners don’t know: an oversold RSI doesn’t mean “buy now.” It means “the asset has dropped rapidly, and historically, reversals sometimes follow.” Chartscope’s AI Chat explains this distinction — and never frames it as a signal.
The Moving Average Convergence Divergence (MACD) shows the relationship between two moving averages. When the MACD line crosses above the signal line, it indicates upward momentum. But in a ranging market, these crossovers can be false. Chartscope’s Enriched Insights includes indicator conflict detection, which flags when RSI and MACD are sending contradictory messages — a feature that directly addresses the confusion beginners face.
A Step-by-Step Guide to Using Chartscope for Indicator Interpretation
Here’s how a beginner in Romania can use Chartscope to understand a crypto chart in under 5 minutes:
- Open Chartscope and connect a read-only exchange API (stored securely in iOS Keychain — never leaves your device).
- Select a coin and timeframe (e.g., BTC/USDT on the 4-hour chart).
- Tap “AI Chat” and ask: “What does the current RSI value mean for Bitcoin?”
- Review the Enriched Insights cards — look for “Market Mood” thermometer (0-100 scale) and “Indicator Conflict Detection.”
- If you see conflicting signals, ask Chartscope: “Why does RSI say oversold but MACD says bearish?” The AI explains the reasoning behind each indicator.
- Take a screenshot of your exchange chart and use AI Vision to identify candlestick patterns you might have missed.
- Repeat with different timeframes to understand the broader trend context.
This process replaces hours of YouTube tutorials and forum scrolling with a single, focused learning session.
Privacy and Security in Crypto Education: The Chartscope Advantage

Why Privacy Matters for Romanian Crypto Users
Romania’s Law 129/2019 on anti-money laundering requires cryptocurrency service providers to implement Know Your Customer (KYC) procedures. But when you use a learning app, you shouldn’t have to surrender your personal data just to understand a chart. Chartscope’s approach is fundamentally different: the app does not collect, store, or transmit your personal data to external servers for ML processing.
This is not a marketing claim — it’s a technical architecture choice. The app stores API credentials exclusively in the iOS Keychain with hardware-level encryption. User preferences (currency, language, theme) stay in local iOS UserDefaults. Market data fetched from exchanges may be cached temporarily for performance, but it never leaves your device for AI processing.
The Privacy-First Approach in Practice
Unlike most crypto apps that embed analytics SDKs, sell user behavior data, or require account creation, Chartscope runs no tracking scripts and collects zero personal data. For Romanian users concerned about data sovereignty — especially given that Romania falls under GDPR jurisdiction — this eliminates a major compliance headache. You don’t need to worry about where your data is stored, who has access to it, or whether it might be subpoenaed in a future tax audit.
Learn more about Chartscope’s privacy-first approach →
Beyond Trading Signals: Chartscope’s Educational Approach
The Signal-Free Philosophy
The most dangerous phrase in crypto education is “this indicator says you should buy.” Chartscope’s Terms of Service explicitly state: “The App does not provide financial advice, investment recommendations, or trading signals.” This isn’t a limitation — it’s a feature. By removing the pressure to act, the app creates a safe learning environment where users can explore concepts without financial risk.
This approach aligns with recommendations from the European Securities and Markets Authority (ESMA), which has repeatedly warned that retail investors who rely on trading signals often make poorer decisions than those who understand underlying market mechanics.
What Users Actually Learn
Chartscope’s Enriched Insights delivers 9 structured cards covering: - Volatility — How much the price is fluctuating - Indicator Conflicts — When different metrics disagree - Risk/Reward Ratio — Quantified, not guessed - Momentum + Volatility Context — The full picture
Each card is designed to be educational. The “Market Mood” thermometer (0-100) gives a single, digestible number that synthesizes multiple indicators. Beginners can track how Market Mood changes over time, building pattern recognition without needing to memorize indicator formulas.
A Concrete Example
Consider a Romanian user analyzing Ethereum on a daily chart. The RSI shows 72 (overbought), but the MACD is still rising with positive histogram bars. A signal-based tool would scream “sell.” Chartscope’s Enriched Insights would flag the conflict and explain: “RSI suggests the asset is overbought, which historically can precede a pullback. However, MACD momentum is still positive, indicating ongoing buying pressure. These signals contradict each other — monitor for a resolution before forming a conclusion.”
That’s education. Not advice. Not a signal. Just clear, structured understanding.
Frequently Asked Questions
How does Chartscope help beginners interpret crypto charts in Romania? Chartscope explains chart patterns, indicators, and trends in plain language without providing trading signals. Its AI Chat answers specific questions about your chart, while AI Vision identifies candlestick patterns from screenshots. The app supports Romanian language and respects GDPR requirements by processing all ML data on-device.
Does Chartscope provide information on Romanian crypto regulations? Chartscope is an educational tool for chart interpretation, not a legal advisory service. For Romanian tax and regulatory guidance, users should consult official sources like the National Bank of Romania or a qualified tax advisor. Chartscope’s focus is on helping users understand market data, not navigate legal frameworks.
What technical indicators does Chartscope explain for crypto charts? Chartscope explains RSI, MACD, moving averages, candlestick patterns (Doji, Engulfing, Shooting Star, and more), volatility metrics, and momentum indicators. The Enriched Insights feature provides 9 structured cards covering indicator conflicts, risk/reward ratios, and market mood on a 0-100 scale.
Is Chartscope a safe and private way to learn about crypto charts? Yes. Chartscope does not collect personal data, use analytics tracking, or transmit your information to external servers for ML processing. API credentials are stored in the iOS Keychain with hardware encryption. Cloud AI features (chat, vision, explain) require explicit user consent and use Deno Edge Functions.
Can Chartscope help me understand crypto charts without providing trading signals? Absolutely. Chartscope is designed specifically to avoid giving financial advice or trading signals. Its AI explains what indicators mean, why they behave a certain way, and how they relate to each other — but never tells you to buy, sell, or hold any asset.
Ready to understand your crypto charts — not just stare at them?
- ✓ AI explanations for every indicator & pattern
- ✓ On-device ML — your data never leaves your iPhone
- ✓ 9 languages · No trading signals · No financial advice
Download on the App Store — Free 3-Day Trial
€4.99/month after trial · Cancel anytime
Keep Reading
Ready to understand your crypto charts — not just stare at them? Download Chartscope from the App Store and start your 3-day free trial today. No signals. No hype. Just clear, private, on-device education that respects your data and your learning pace.
Start learning with Chartscope →
Last updated: 2026-05-11