Understand Crypto Charts: Beginner's Guide 2026
Understand Crypto Charts: Beginner’s Guide 2026
Last updated: 2026-06-04
Did you know that over 80% of new cryptocurrency traders lose money in their first three months, according to multiple industry reports? The primary reason isn’t bad luck — it’s a lack of understanding of what the charts are actually telling them. Crypto technical analysis is the skill that separates guesswork from informed decision-making, yet most beginners never learn it properly.
This guide will teach you how to read crypto charts, understand candlestick patterns, and use AI-powered tools to accelerate your learning — all without relying on trading signals or financial advice.
Why Understanding Crypto Charts is Essential for Beginners
The Cost of Chart Illiteracy
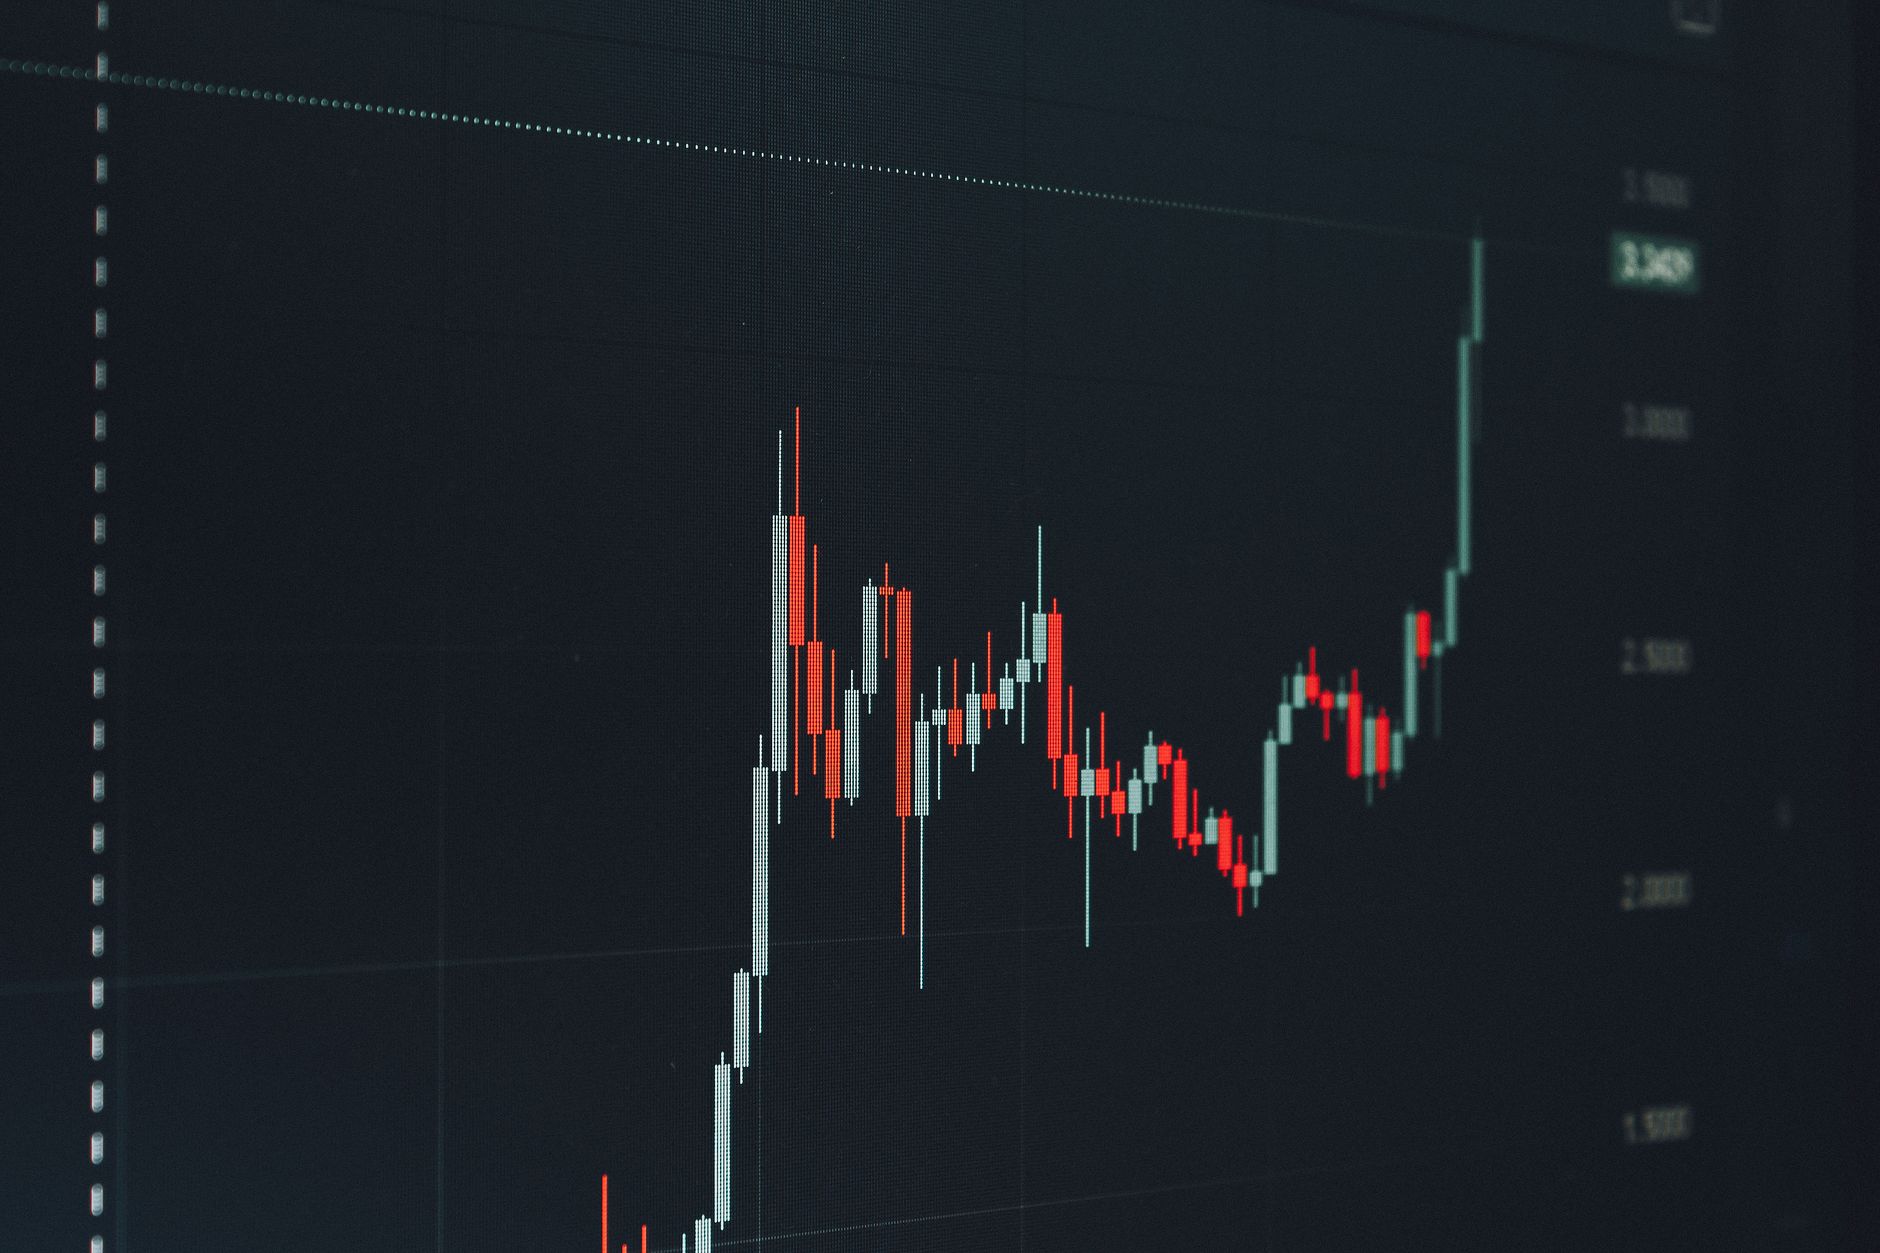
When you open a crypto chart for the first time, it looks like a chaotic mess of red and green bars, squiggly lines, and confusing abbreviations. Most beginners respond by either ignoring the chart entirely (and trading blind) or following random “experts” on social media. Both approaches lead to the same outcome: unnecessary losses.
Crypto technical analysis is simply the practice of using historical price data and trading volume to understand market psychology. It doesn’t predict the future — it helps you make sense of what’s happening right now.
What You Actually Gain by Learning Charts
- Context for price movements: Instead of panicking when Bitcoin drops 5%, you’ll understand whether it’s a normal retracement or a trend reversal.
- Pattern recognition: You’ll spot formations that historically preceded significant moves.
- Confidence in your own analysis: You won’t need to rely on anonymous social media accounts for trading ideas.
According to the Chartscope documentation, the app’s educational mission is rooted in a “simple observation: understanding cryptocurrency markets shouldn’t require expensive courses or years of experience.” This is the core philosophy behind every feature.
The Basics of Crypto Chart Analysis: Candlesticks & Trends

Understanding Candlestick Patterns Explained
Every crypto chart is built from candlesticks. Each candlestick represents price action over a specific time period — one hour, one day, one week. Here’s what each part means:
| Candlestick Component | What It Shows | Why It Matters |
|---|---|---|
| Body (green or red) | Opening and closing prices | Green means price went up; red means price went down |
| Upper wick | Highest price during the period | Long upper wick = sellers rejected higher prices |
| Lower wick | Lowest price during the period | Long lower wick = buyers defended lower prices |
| Range (high to low) | Total price movement | Wider range = more volatility |
Key candlestick patterns for beginners: - Doji: Opening and closing prices are nearly equal — market indecision - Engulfing: A large candle completely “swallows” the previous candle — potential trend reversal - Shooting Star: Small body with long upper wick after an uptrend — bearish signal - Hammer: Small body with long lower wick after a downtrend — bullish signal
Identifying Trends
Trends are the foundation of all technical analysis. There are only three types:
- Uptrend: Higher highs and higher lows
- Downtrend: Lower highs and lower lows
- Sideways (ranging): Price moves within a horizontal channel
Learn crypto charts by practicing this: Open any cryptocurrency chart and identify the current trend. Is it making higher highs? Lower lows? Neither? This single observation tells you more than most indicators.
Pro tip: Draw a simple trendline connecting at least two swing lows (in an uptrend) or swing highs (in a downtrend). If price respects that line multiple times, the trend is strong.
Demystifying Technical Indicators with AI: RSI, MACD, and More
What Technical Indicators Actually Do
Technical indicators are mathematical calculations based on price and volume. They don’t predict the future — they quantify what the chart is already showing. For beginners, the problem is that indicators come with confusing thresholds, crossovers, and divergences that seem overwhelming.
Crypto indicators for beginners should focus on just two tools initially:
RSI (Relative Strength Index)
- What it measures: Speed and magnitude of recent price changes (0–100 scale)
- Key levels: Above 70 = overbought (potentially overvalued); Below 30 = oversold (potentially undervalued)
- Beginner mistake: Assuming “overbought” means “will crash now” — price can stay overbought for weeks in strong trends
MACD (Moving Average Convergence Divergence)
- What it measures: Relationship between two moving averages
- Key signals: When the MACD line crosses above the signal line = bullish momentum; crossing below = bearish momentum
- Beginner mistake: Trading every crossover without checking the overall trend direction
How AI Makes This Accessible
Chartscope uses on-device machine learning to explain these indicators in plain language. Instead of memorizing formulas, you can ask the AI Chat questions like:
- “Why is RSI showing 72 on Bitcoin’s 4-hour chart?”
- “What does this MACD crossover mean in the context of the current uptrend?”
The AI provides educational answers without trading signals — it explains, it doesn’t recommend.
Step-by-Step: How to Use AI to Learn an Indicator
- Open Chartscope and connect your exchange (read-only API — your keys never leave your device)
- Navigate to any chart and tap the AI Chat icon
- Ask a specific question: “Explain RSI on this 1-hour Ethereum chart”
- Review the response: The AI will describe current RSI values, historical context, and what the indicator suggests about momentum
- Follow up: “What would a bearish divergence look like here?”
- Repeat: Practice with different timeframes and coins until the concepts become intuitive
For a deeper dive, read our dedicated guide on RSI & MACD Indicators Explained for Crypto Charts 2026.
Chartscope: Your Private AI Educator for Crypto Charts
How On-Device Machine Learning Changes the Game
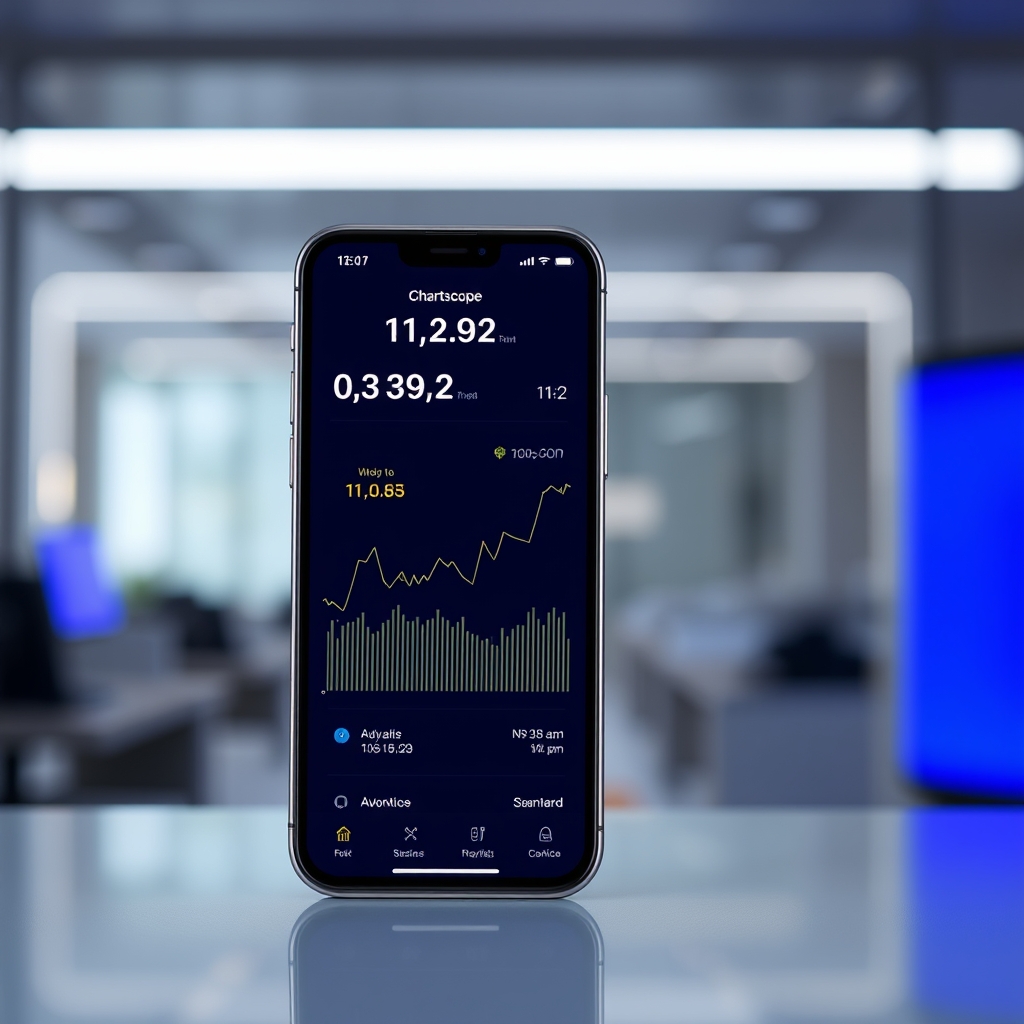
Most crypto education apps send your chart data to cloud servers for analysis. Chartscope takes a different approach: all AI processing happens locally on your iPhone using Apple’s Core ML framework.
According to the site documentation, CoreML trend classification runs on your iPhone Neural Engine with approximately 1 millisecond inference time. This means:
- Zero data leaves your device for machine learning analysis
- No internet required for AI features after initial setup
- Instant results — no waiting for cloud processing
Privacy by Design — Not Just a Marketing Slogan
The Chartscope privacy policy explicitly states: “We do not collect, store, or transmit your personal data to external servers.” This includes:
- No personal identification information
- No email addresses or contact details
- No usage analytics or tracking data
- No portfolio data or trading history
Your exchange API keys are stored exclusively in the iOS Keychain with hardware-level encryption. They never leave your device.
Feature Comparison: Chartscope vs. Traditional Learning
| Learning Method | Cost | Privacy | Real Charts | AI Explanations | Languages |
|---|---|---|---|---|---|
| YouTube tutorials | Free | Public | No | No | 1–2 |
| Paid courses | $50–$500 | Varies | Sometimes | No | 1 |
| Chart analysis platforms alone | Free–$50/mo | Limited | Yes | No | 1–2 |
| Chartscope | €4.99/mo | Zero tracking | Yes | Yes | 9 |
9 Languages, One Learning Experience
Chartscope supports English, Romanian, German, French, Spanish, Italian, Portuguese, Chinese, and Japanese. The AI explains technical concepts in your native language — no need to learn English financial jargon to understand crypto charts.
Learn more about the team’s mission on the About page.
Beyond the Basics: Advanced Chart Patterns Explained
Pattern Recognition with AI Vision
Once you understand individual candlesticks and basic trends, the next step is recognizing multi-candle patterns. Chartscope’s AI Vision feature analyzes your chart screenshots and identifies formations like:
- Head and Shoulders: Three peaks with the middle being highest — potential trend reversal
- Double Top/Bottom: Price tests a level twice and fails — strong support/resistance
- Triangles (ascending, descending, symmetrical): Price compresses before a breakout
- Flags and Pennants: Brief consolidation after a strong move — trend continuation
How AI Vision Works in Practice
- Take a screenshot of any crypto chart
- Open AI Vision in Chartscope
- The Vision LLM reads your chart screenshot and identifies patterns
- You receive an educational explanation of what the pattern means historically
- The AI can also confirm or enrich text-based analysis from AI Chat
Important: AI Vision requires separate consent — you control visual AI independently from text-based features.
The Limitations You Should Know
No tool — including AI — can predict where a cryptocurrency price will go next. Chartscope’s terms of service explicitly state: “All AI analysis represents pattern recognition, not financial advice.” The goal is education, not prediction.
Start Your Crypto Chart Education Journey Today
Your 7-Day Learning Plan
| Day | Focus | Action |
|---|---|---|
| 1 | Candlestick basics | Identify 10 Doji patterns on any chart |
| 2 | Trend identification | Draw trendlines on 3 different coins |
| 3 | RSI fundamentals | Ask Chartscope AI to explain RSI on your portfolio |
| 4 | MACD crossovers | Practice identifying crossovers in different market conditions |
| 5 | Support & resistance | Mark key levels on a Bitcoin daily chart |
| 6 | Pattern recognition | Use AI Vision to scan for patterns |
| 7 | Full analysis | Combine all skills to analyze one chart completely |
Why Start Now
The cryptocurrency market operates 24/7. Every day you delay learning chart analysis is a day you’re making decisions without understanding the data. With Chartscope’s 3-day free trial, you can test whether AI-powered education works for you before committing.
This is educational content, not financial advice. Always do your own research before investing.
FAQ
What is the best way for beginners to understand crypto charts?
Start with candlestick basics — learn to read a single candle before analyzing patterns. Then practice identifying trends (uptrend, downtrend, ranging) on any cryptocurrency chart. Use an educational tool like Chartscope that explains indicators in plain language without trading signals. Focus on understanding what the chart shows, not guessing what will happen next.
How can AI help me learn crypto technical analysis?
AI can explain technical indicators in context, identify candlestick patterns from screenshots, and answer follow-up questions about specific chart movements. Chartscope’s AI Chat provides multi-turn conversational analysis that adapts to your current coin and timeframe. The AI Vision feature reads chart screenshots to identify patterns like Doji, Engulfing, and Shooting Star formations.
Does Chartscope provide trading signals or predictions?
No. Chartscope is designed for educational and informational purposes only. The app does not provide financial advice, investment recommendations, or trading signals. All AI analysis represents pattern recognition, not financial advice. The terms of service explicitly state users should “not make any financial decisions based solely on information provided by this App.”
Is my data private when using Chartscope for chart analysis?
Yes. Chartscope processes all AI analysis on your device using Apple’s Core ML framework — no data is sent to external servers for machine learning. The app collects zero personal data, uses no analytics, and runs no tracking scripts. Your exchange API keys are stored exclusively in the iOS Keychain with hardware-level encryption.
What technical indicators can I learn with Chartscope?
Chartscope covers RSI (Relative Strength Index), MACD (Moving Average Convergence Divergence), candlestick patterns (Doji, Engulfing, Shooting Star, Hammer), trend analysis, volatility metrics, momentum indicators, and risk/reward ratios. The Enriched Insights feature provides 9 structured cards covering market mood, indicator conflicts, and market context.
Continue Learning
- Crypto Technical Analysis for Beginners in Romania 2026
- Chartscope Review: AI Crypto Chart Analysis App 2026
- RSI & MACD Explained Simply for Crypto Charts 2026
Last updated: 2026-06-04. This content is for educational purposes only and does not constitute financial advice.